The NBA’s Disappearing Home Court Advantage: A 43-Year Data Investigation
Home court advantage in the NBA has collapsed from 68% to 55% over four decades. We analyzed 52,349 games and systematically tested ten hypotheses to find out why.
An analysis of 104,698 team-game records across 43 NBA seasons (1983–2026), 4,638 EuroLeague games, and 9,276 EuroLeague box scores.
1. The Decline: From 68% to 55%
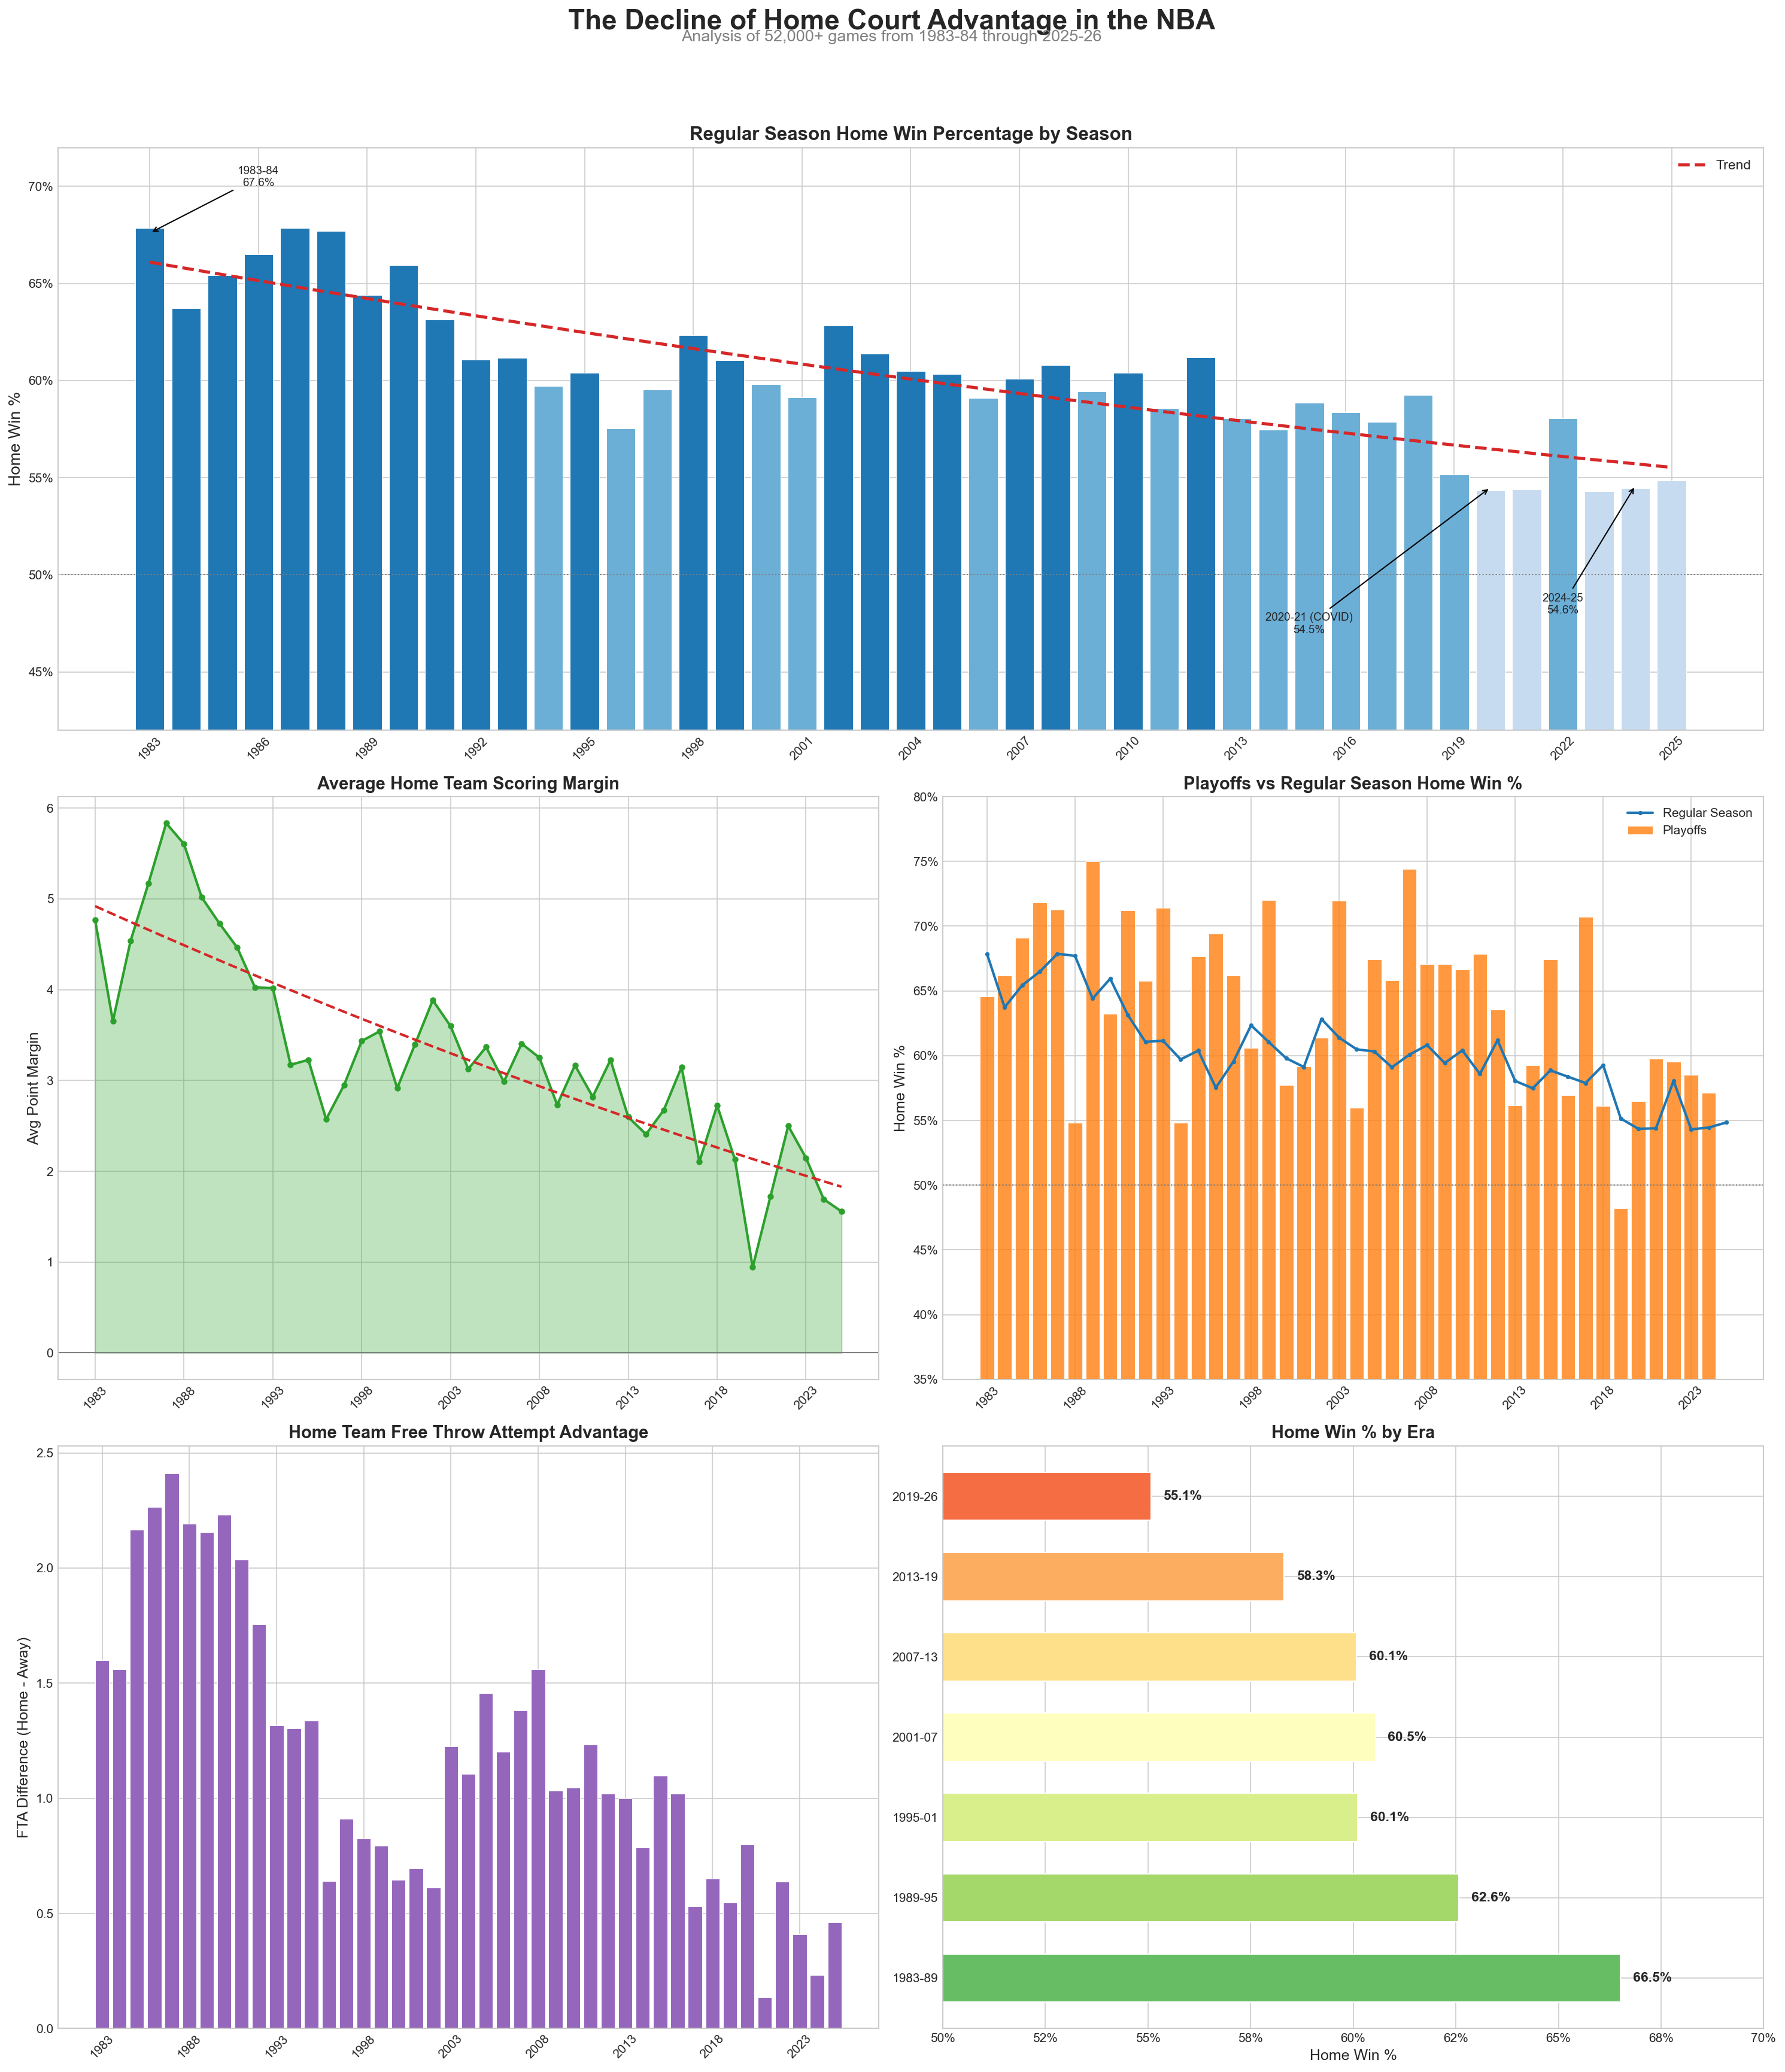
Playing at home used to be one of the most reliable advantages in professional sports. In the 1983–84 NBA season, home teams won nearly 68% of their games. Today, that number has collapsed to roughly 55% — barely better than a coin flip.
The decline hasn’t been sudden. It’s been a slow, steady erosion over four decades, cutting across every era of the NBA. The 1980s averaged 66.2% home win rates. The 2020s average just 55.1%. That’s a drop of more than 11 percentage points — one of the most significant structural shifts in modern basketball.
| Era | Home Win % | Avg Home Margin |
|---|---|---|
| 1983–92: Bird / Magic / Jordan Rise | 65.8% | +4.9 pts |
| 1992–98: Jordan Dynasty / Expansion | 59.9% | +3.3 pts |
| 1999–04: Post-Lockout / Defensive Era | 61.0% | +3.5 pts |
| 2005–13: LeBron / Analytics Emergence | 60.1% | +3.1 pts |
| 2014–19: Warriors / 3-Point Revolution | 58.3% | +2.6 pts |
| 2020–26: Post-COVID / Modern | 55.1% | +1.8 pts |
The average scoring margin tells the same story. Home teams used to win by an average of 5 points. Now it’s under 2. The home court advantage hasn’t just weakened — it has fundamentally changed what it means to play at home.
2. Not All Teams Are Equal: HCA by Franchise
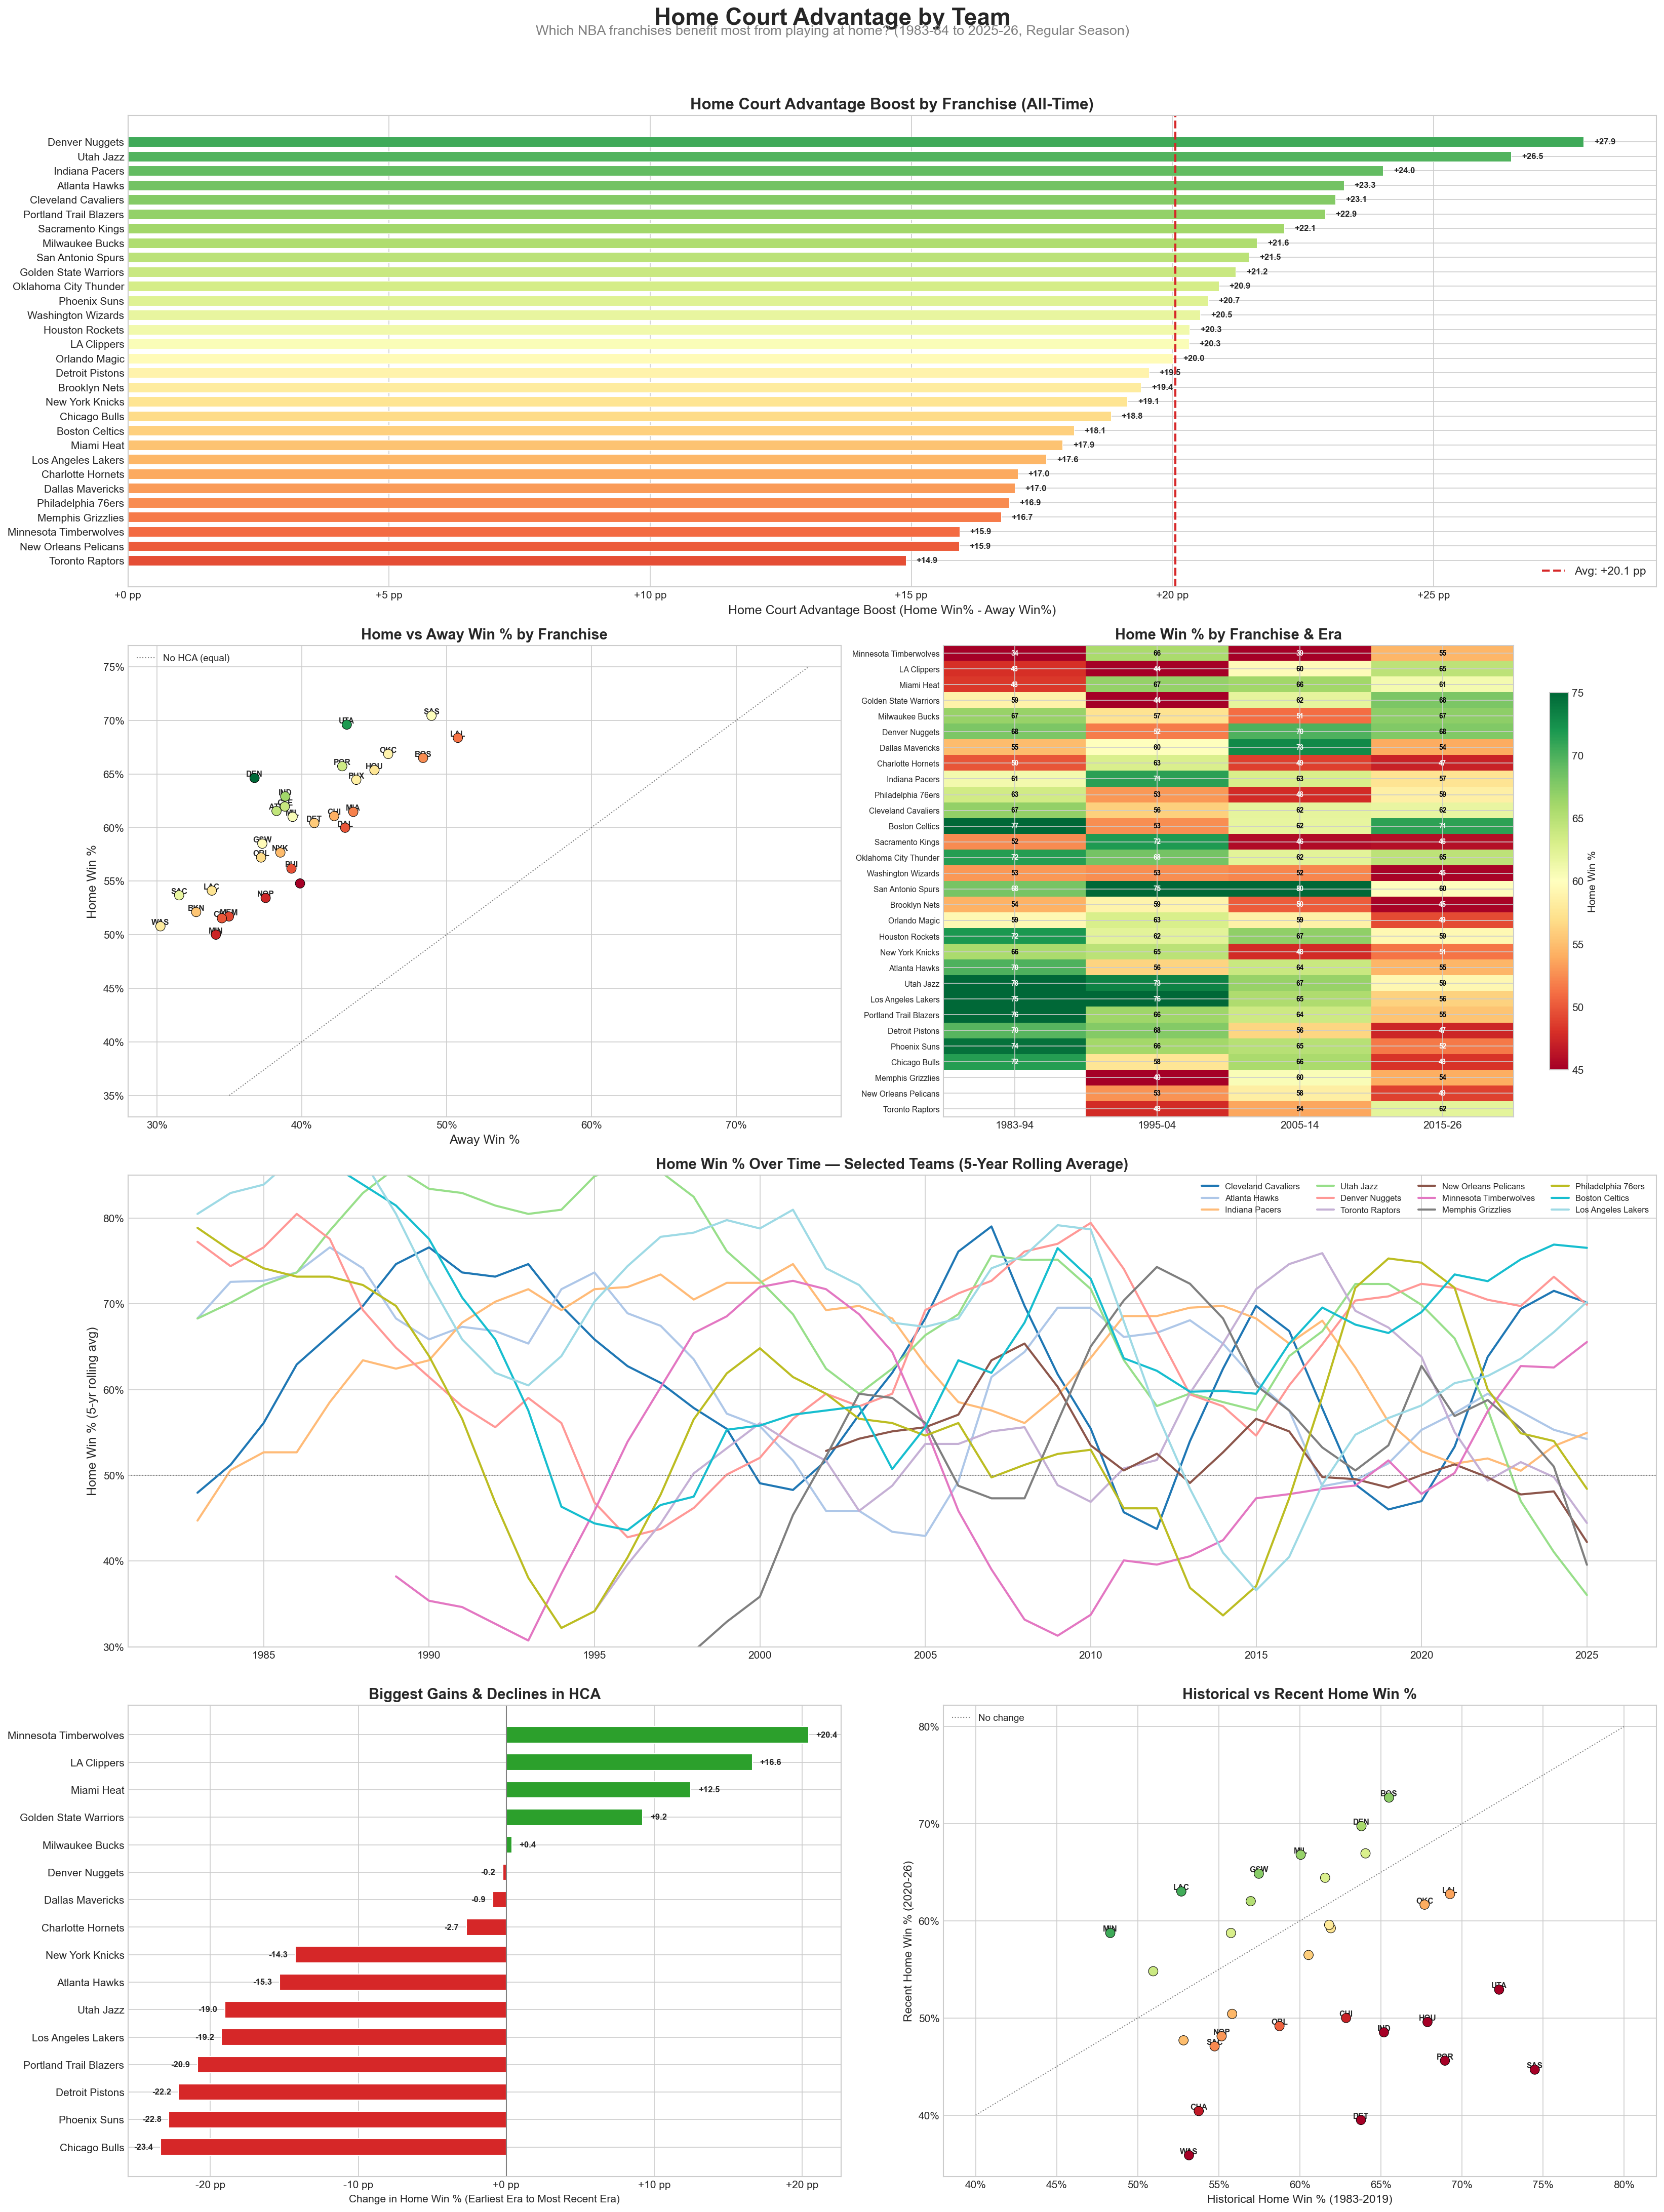
While the league-wide trend is clear, the story varies dramatically by franchise. Some teams have historically been nearly unbeatable at home, while others barely notice the difference.
The Altitude Advantage
Denver (+27.9 pp) and Utah (+26.5 pp) stand out dramatically. Denver’s Mile High altitude (5,280 feet) and Utah’s elevation (4,327 feet) create a physiological disadvantage for visiting teams. Their lungs aren’t adapted to the thinner air, and conditioning suffers. This is the one form of home court advantage that modern analytics and travel improvements simply cannot overcome.
The Universal Decline
Nearly every franchise has seen their HCA shrink. The biggest losers include Chicago (-23.4 pp from their peak era), Phoenix (-22.8 pp), Detroit (-22.2 pp), and Portland (-20.9 pp). Only a handful of teams — Minnesota, the LA Clippers, and Golden State — have actually improved their HCA, largely because they were historically terrible and became competitive franchises.
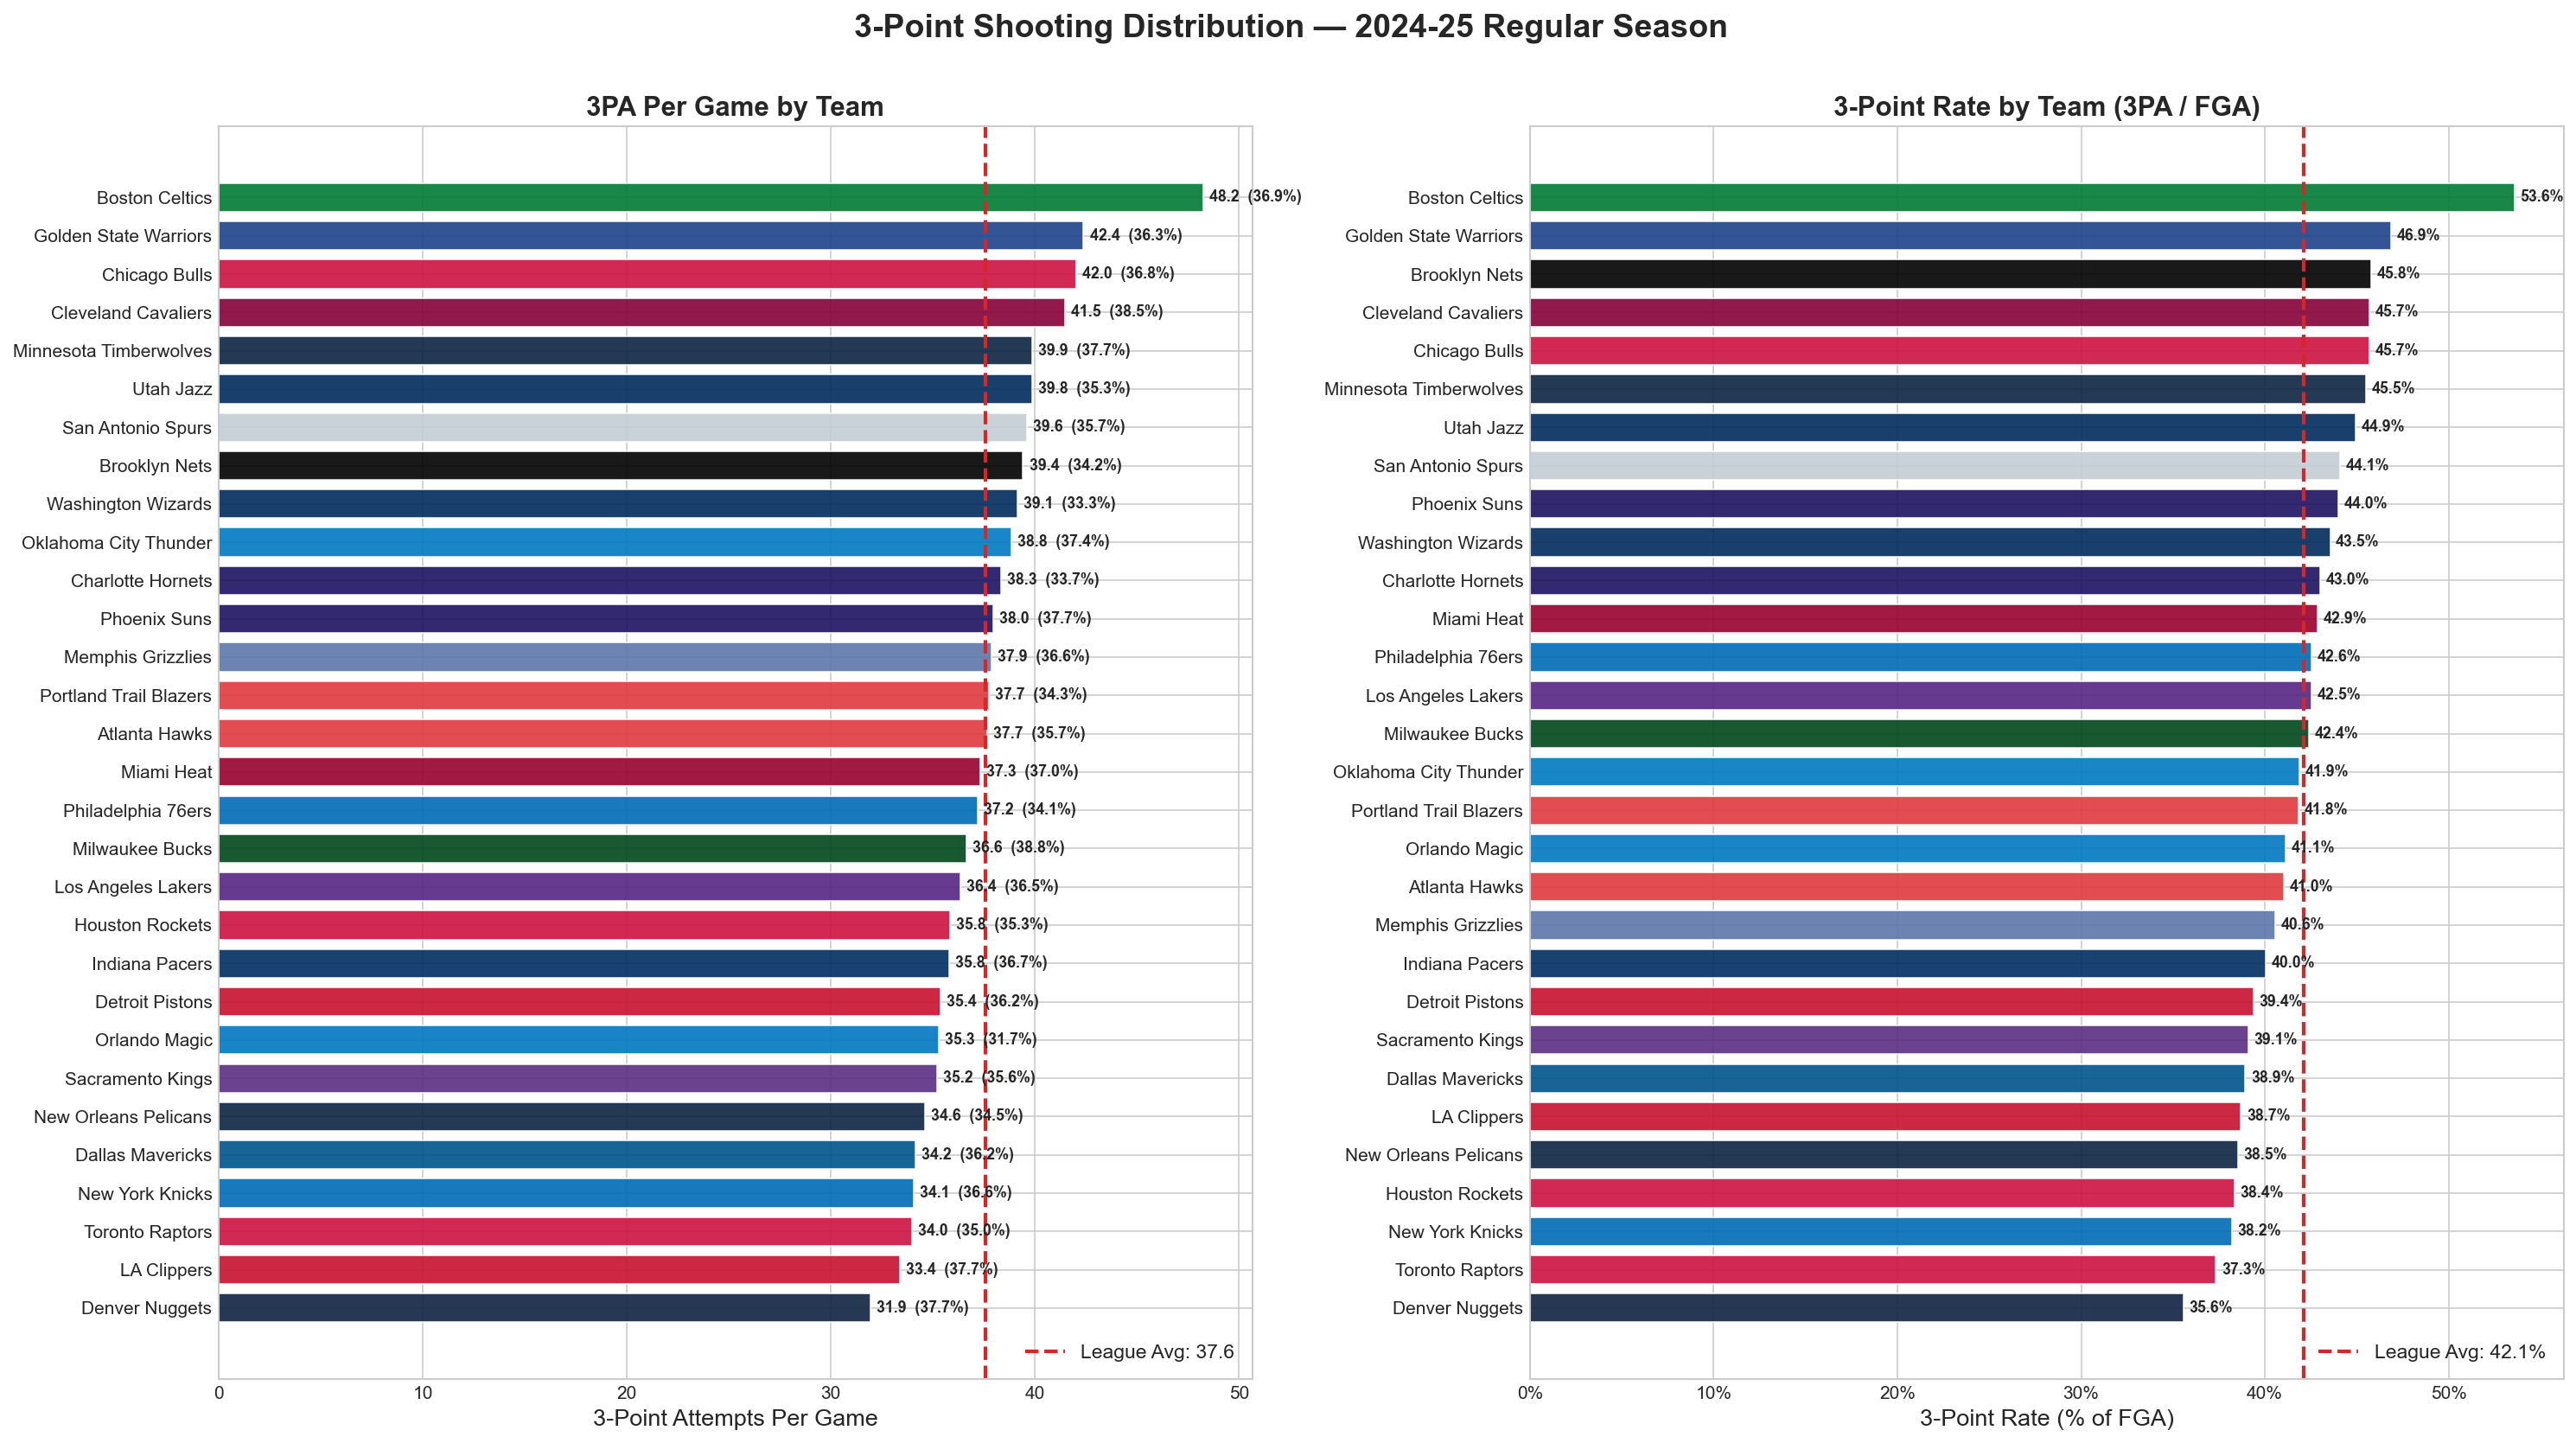
3. The 2024–25 Season in Focus
The 2024–25 season illustrated the modern landscape of home court advantage with striking clarity.
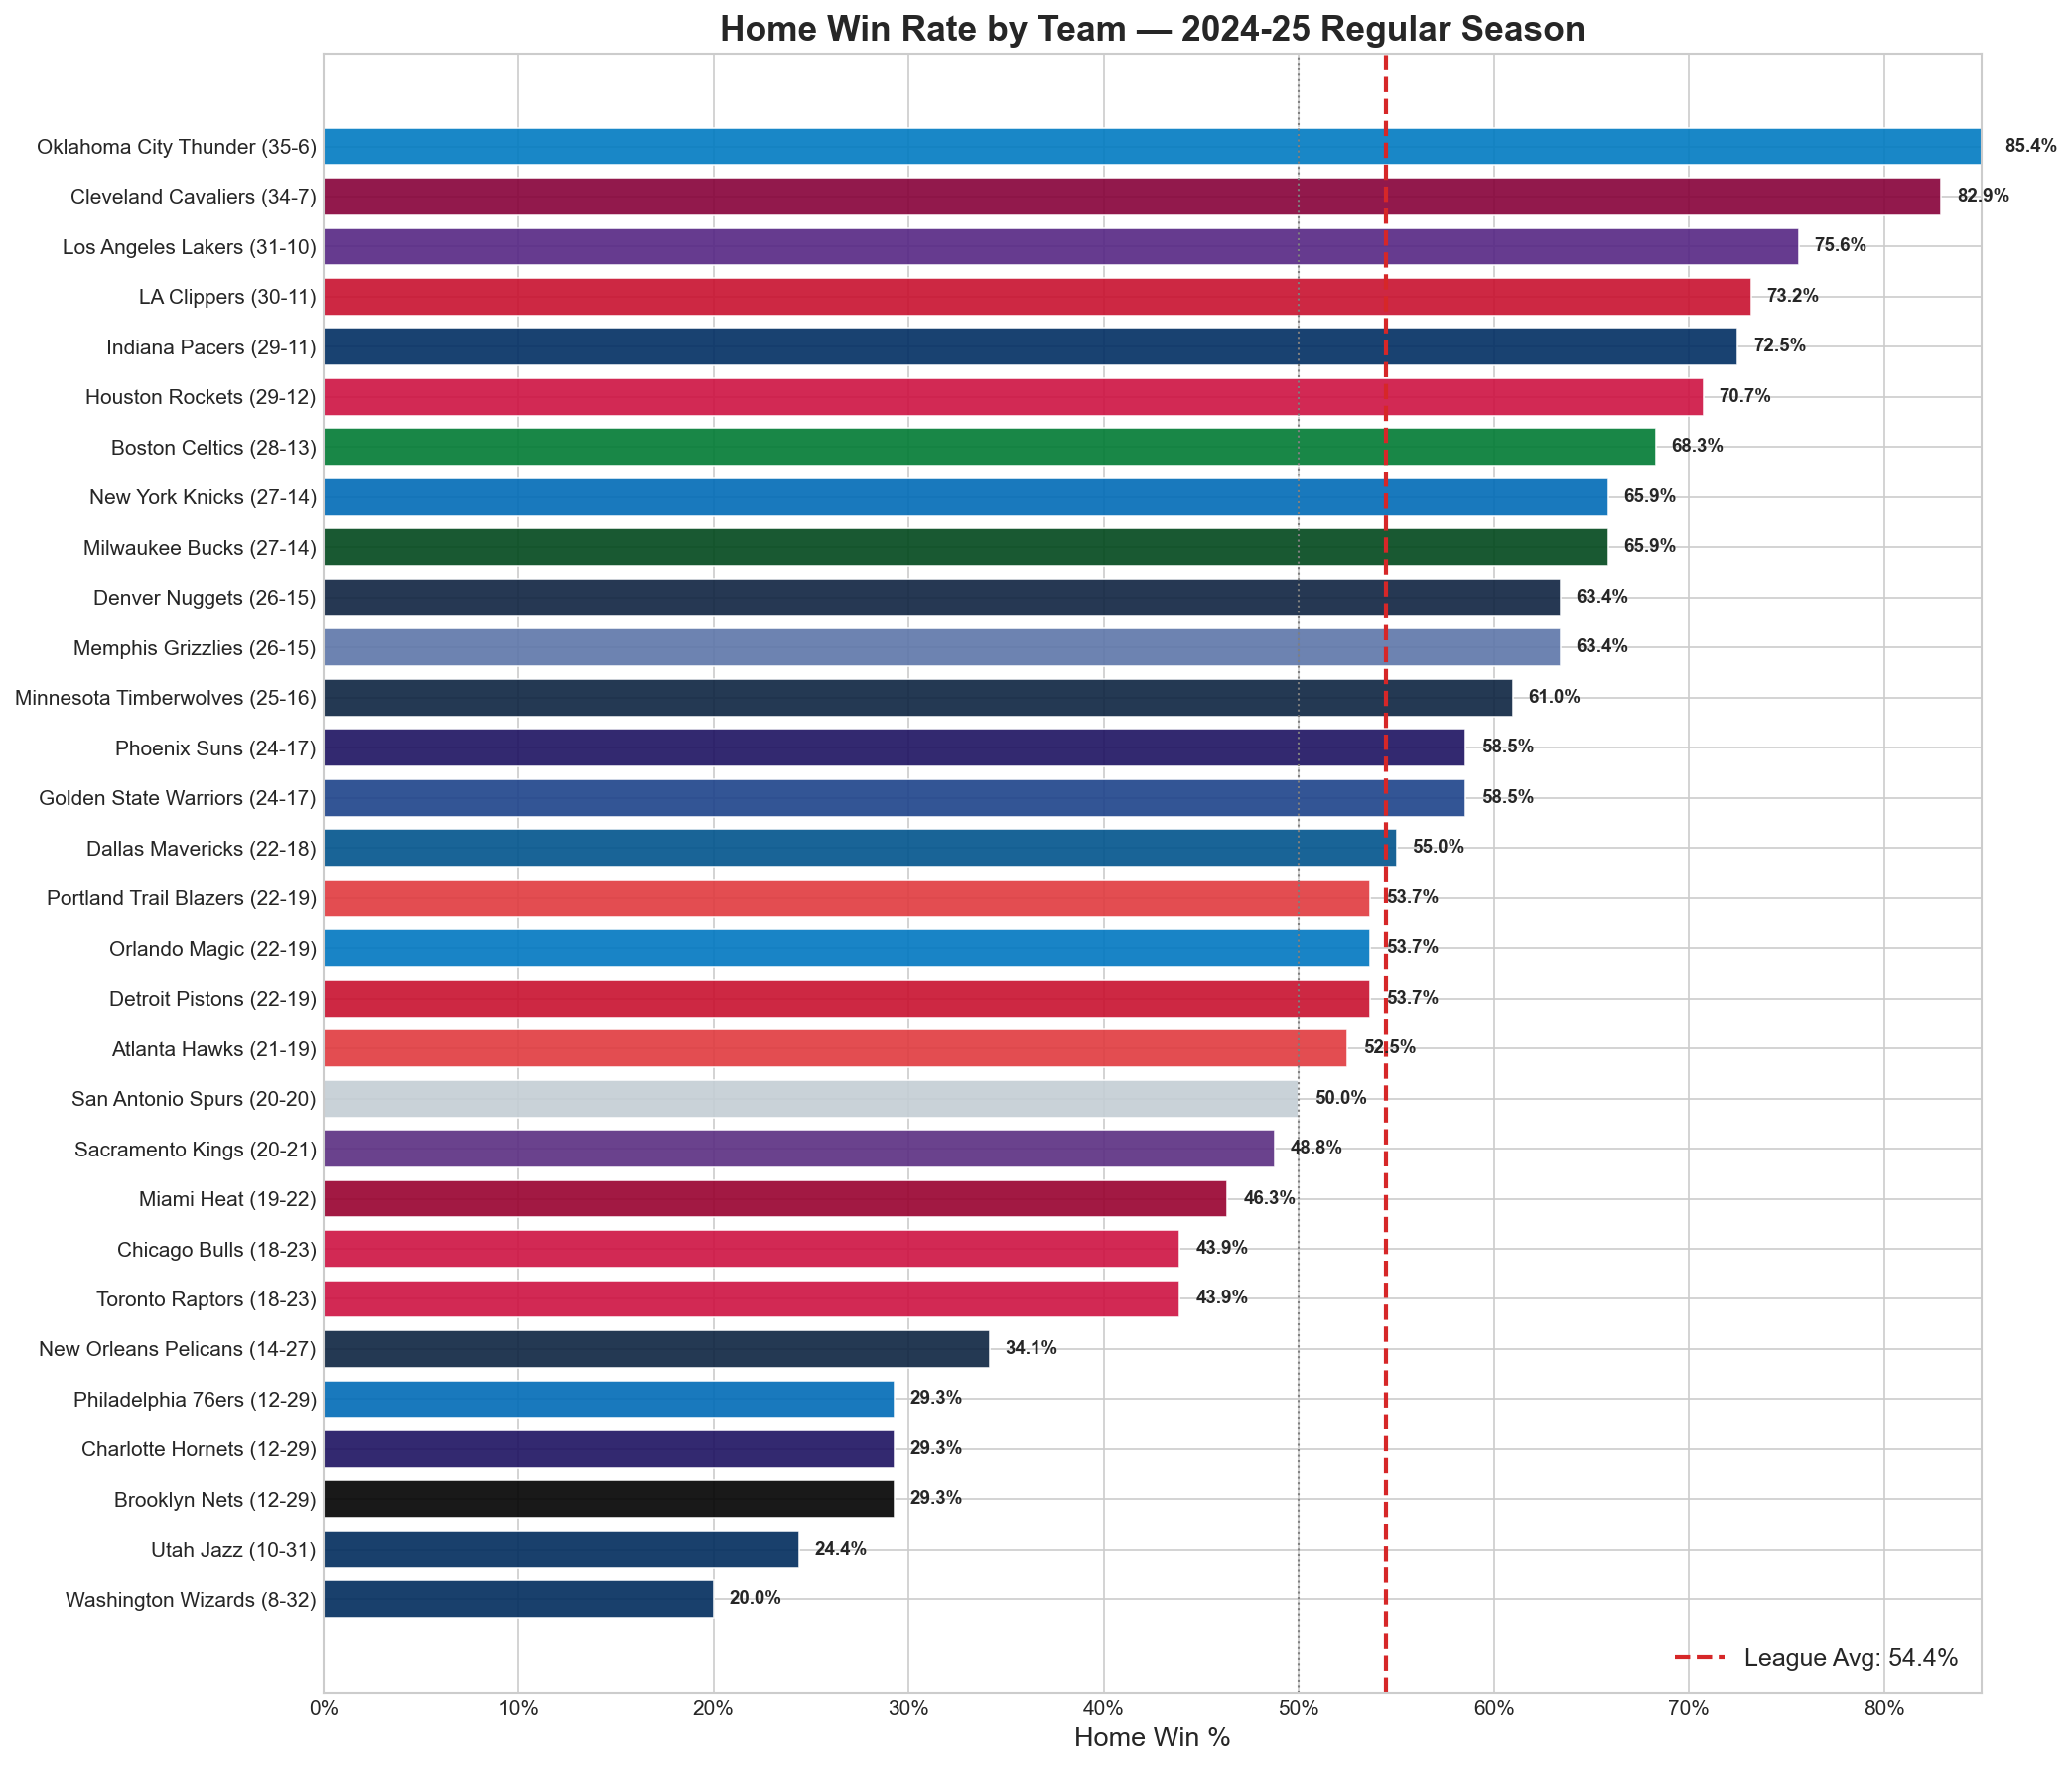
Oklahoma City dominated at home (85.4%, going 35–6), while Washington was essentially a guaranteed loss for the home team (20.0%, just 8–32). The league average of 54.4% continued the historically low trend.
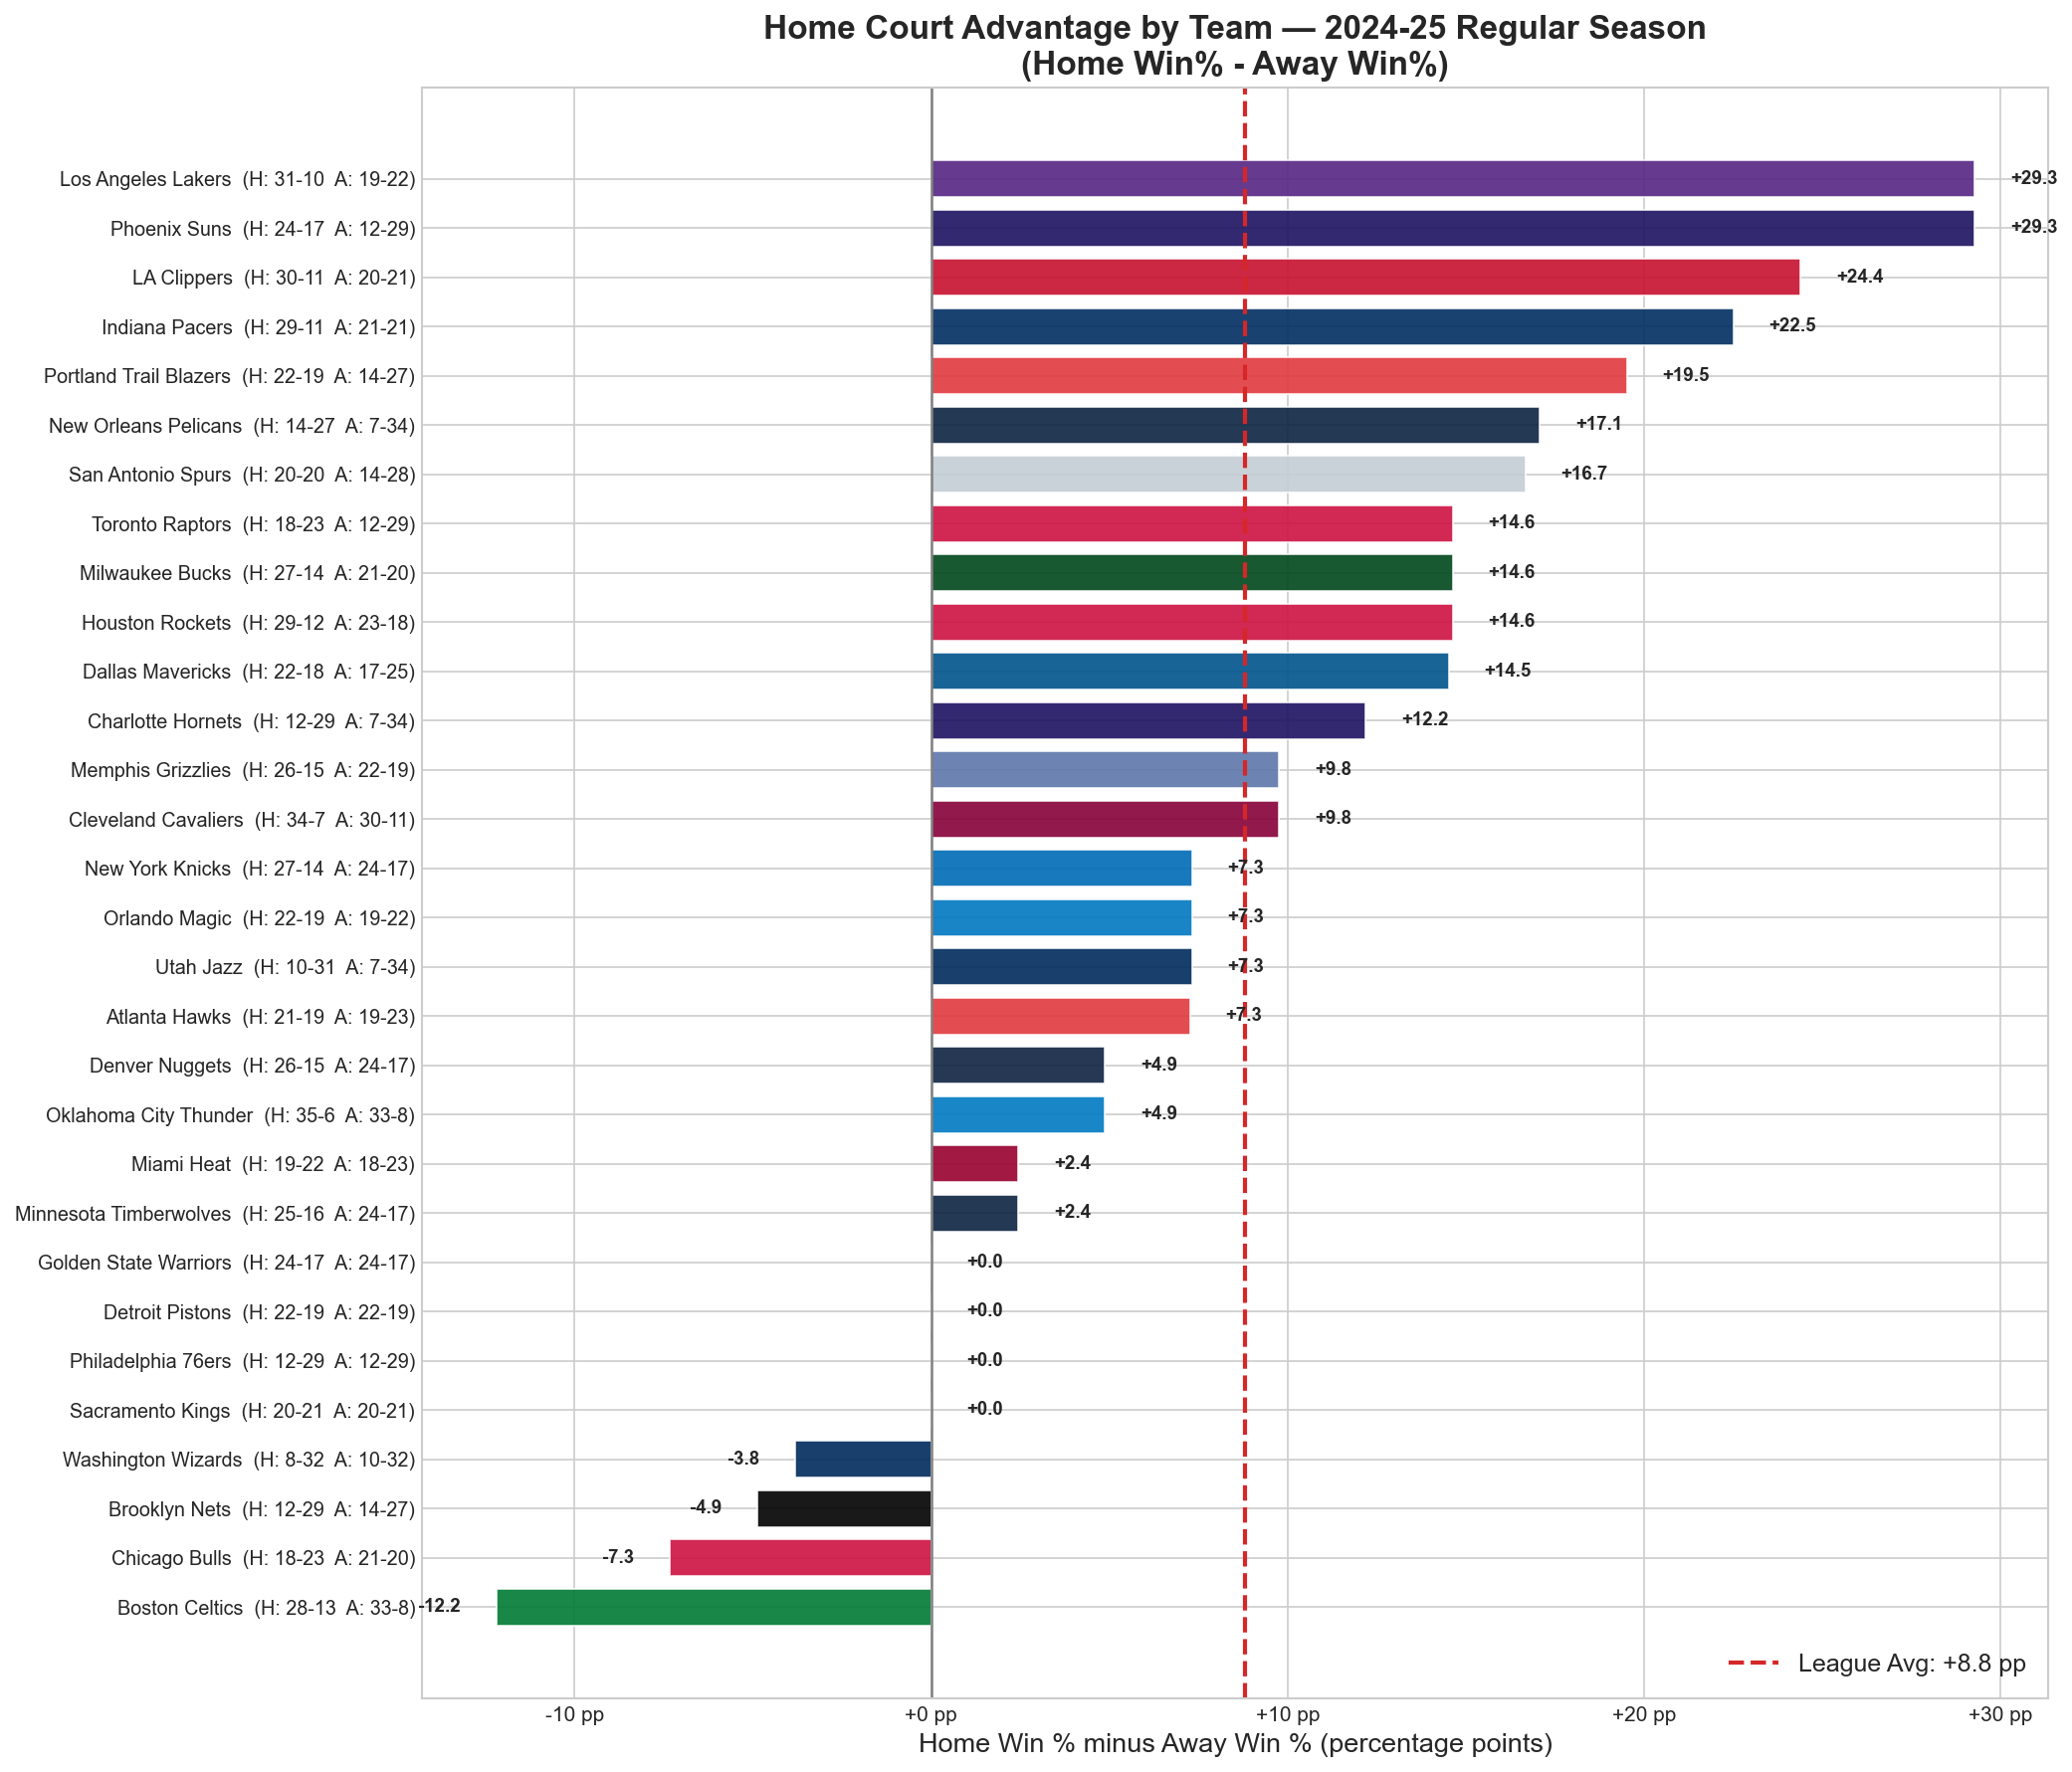
The most striking finding: the Lakers and Suns each had a +29.3 percentage point split between home and away performance. Both are older, star-dependent rosters with limited depth — they excel in the comfort of home but get exposed on the road. Meanwhile, Boston posted a negative split (-12.2 pp), winning more games away than at home.
4. Testing the Hypotheses
Why has home court advantage declined? We systematically tested eight candidate explanations, using statistical analysis, natural experiments, and cross-league comparisons. Some factors contributed. Most didn’t. One stands above the rest.
4a. Back-to-Backs & Load Management
The theory: The NBA has reduced back-to-back games, especially road back-to-backs, making the road schedule easier. Additionally, teams now rest stars on back-to-backs (load management), degrading the quality of play on those nights.
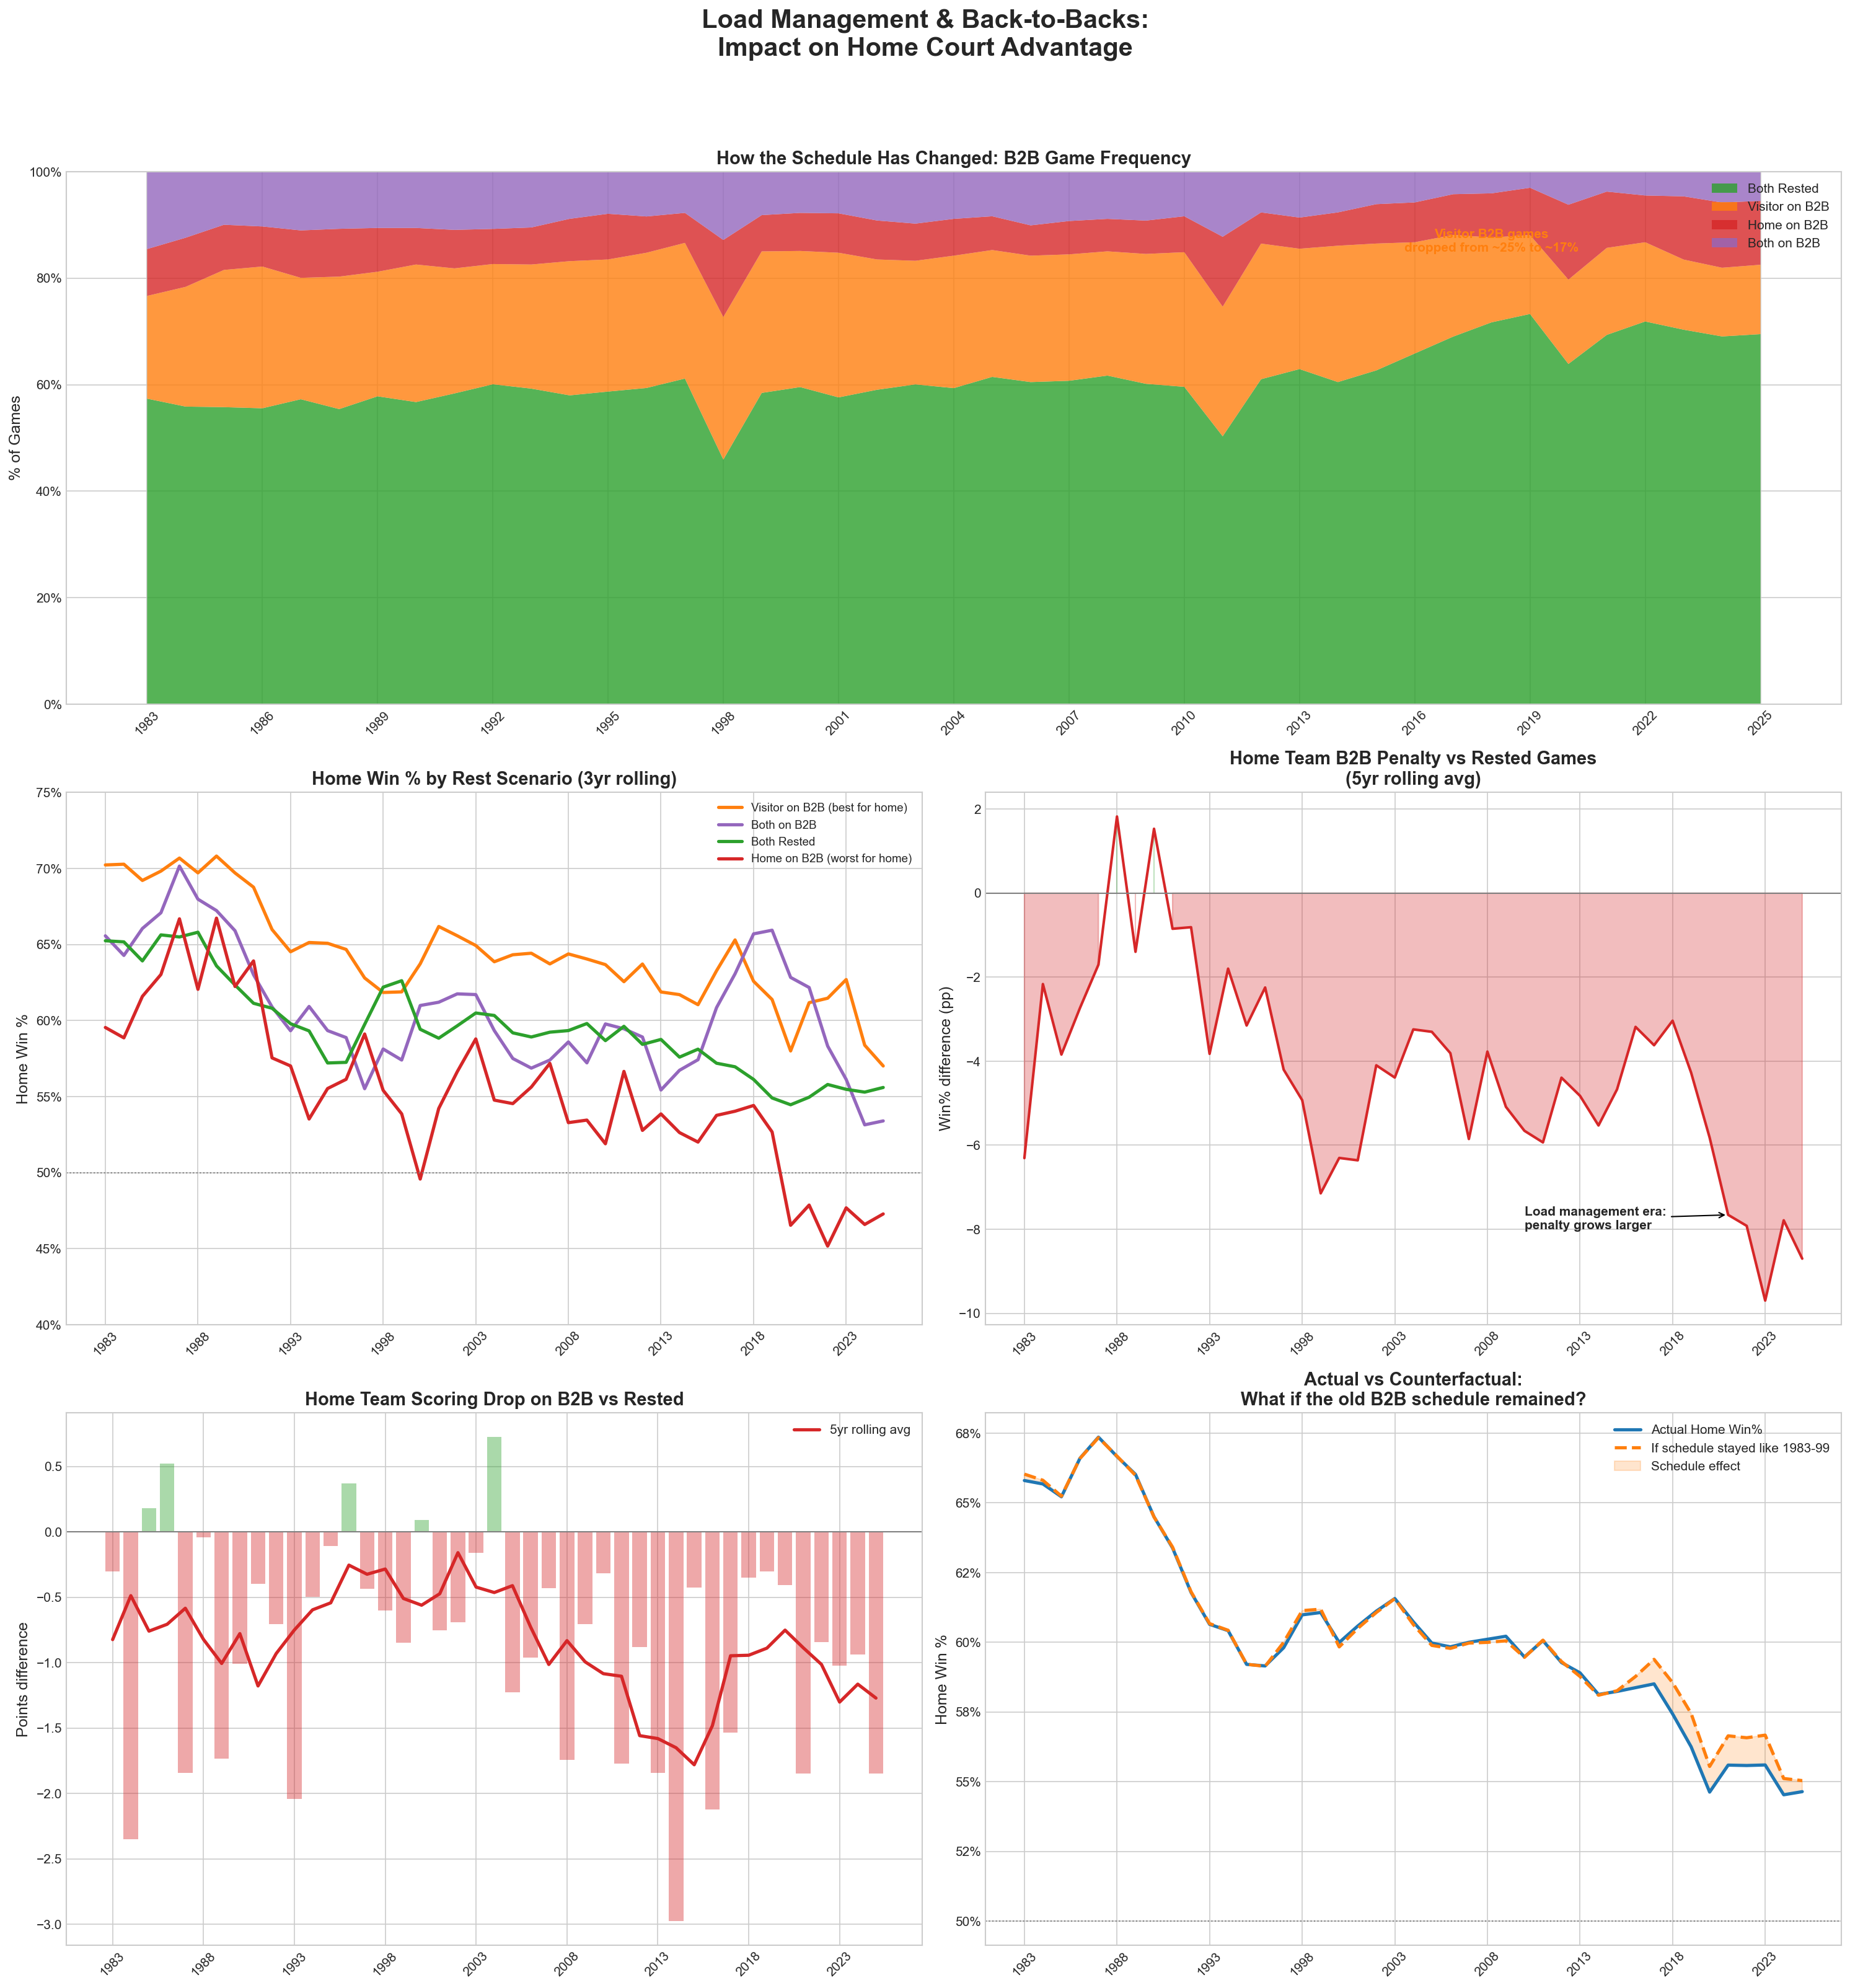
What we found: Visitor back-to-back games dropped from ~35% of away games in the 1980s to ~21% today. And back-to-backs do matter — home teams win 63.6% when the visitor is on a B2B versus 58.6% when they’re rested. But the math only accounts for about 0.8 percentage points of the 8 pp total decline — roughly 10%.
Load management shows a separate fingerprint: home teams playing on B2Bs used to perform just 1–2 pp worse than when rested. In the 2020s, the penalty has ballooned to 5–12 pp, with home teams now winning under 50% on B2Bs. Teams are clearly sitting stars for home B2B games.
But the most revealing finding is what happens when both teams are fully rested: home win% still dropped from 61.9% (1983–99) to 55.9% (2015–25) — a 6 pp decline that has nothing to do with scheduling.
Verdict: Back-to-backs and load management explain roughly 15–20% of the decline. The other 80% is happening even in fully-rested games.
4b. COVID & the Crowd Effect
The theory: COVID disruptions (the bubble, empty arenas) destroyed home court advantage, and it never recovered.
What we found: The 2019–20 “bubble” season played all remaining games at Walt Disney World on neutral courts. The designated “home” team won just 48.2% of playoff games — confirming that without a real home court, there’s no advantage. The 2020–21 season in empty arenas saw home win% drop to 54.4%.
But here’s the critical detail: the pre-shutdown 2019–20 data — normal arenas, full crowds, zero COVID disruption — already showed a home win% of just 55.1%. The decline was underway before the pandemic.
Verdict: COVID didn’t cause the decline — it revealed it. The bubble and empty arenas showed that crowds are worth roughly 2 pp in the regular season and 8–9 pp in the playoffs. But with full crowds back since 2021–22, home win% has stayed stuck at 54–55%. The crowds came back but the advantage didn’t.
4c. The 3-Point Revolution
The theory: The massive shift toward 3-point shooting has eroded home court advantage because the 3-pointer is a more “portable” shot — it translates equally well on any court, unlike drives to the rim that benefit from crowd-influenced foul calls.
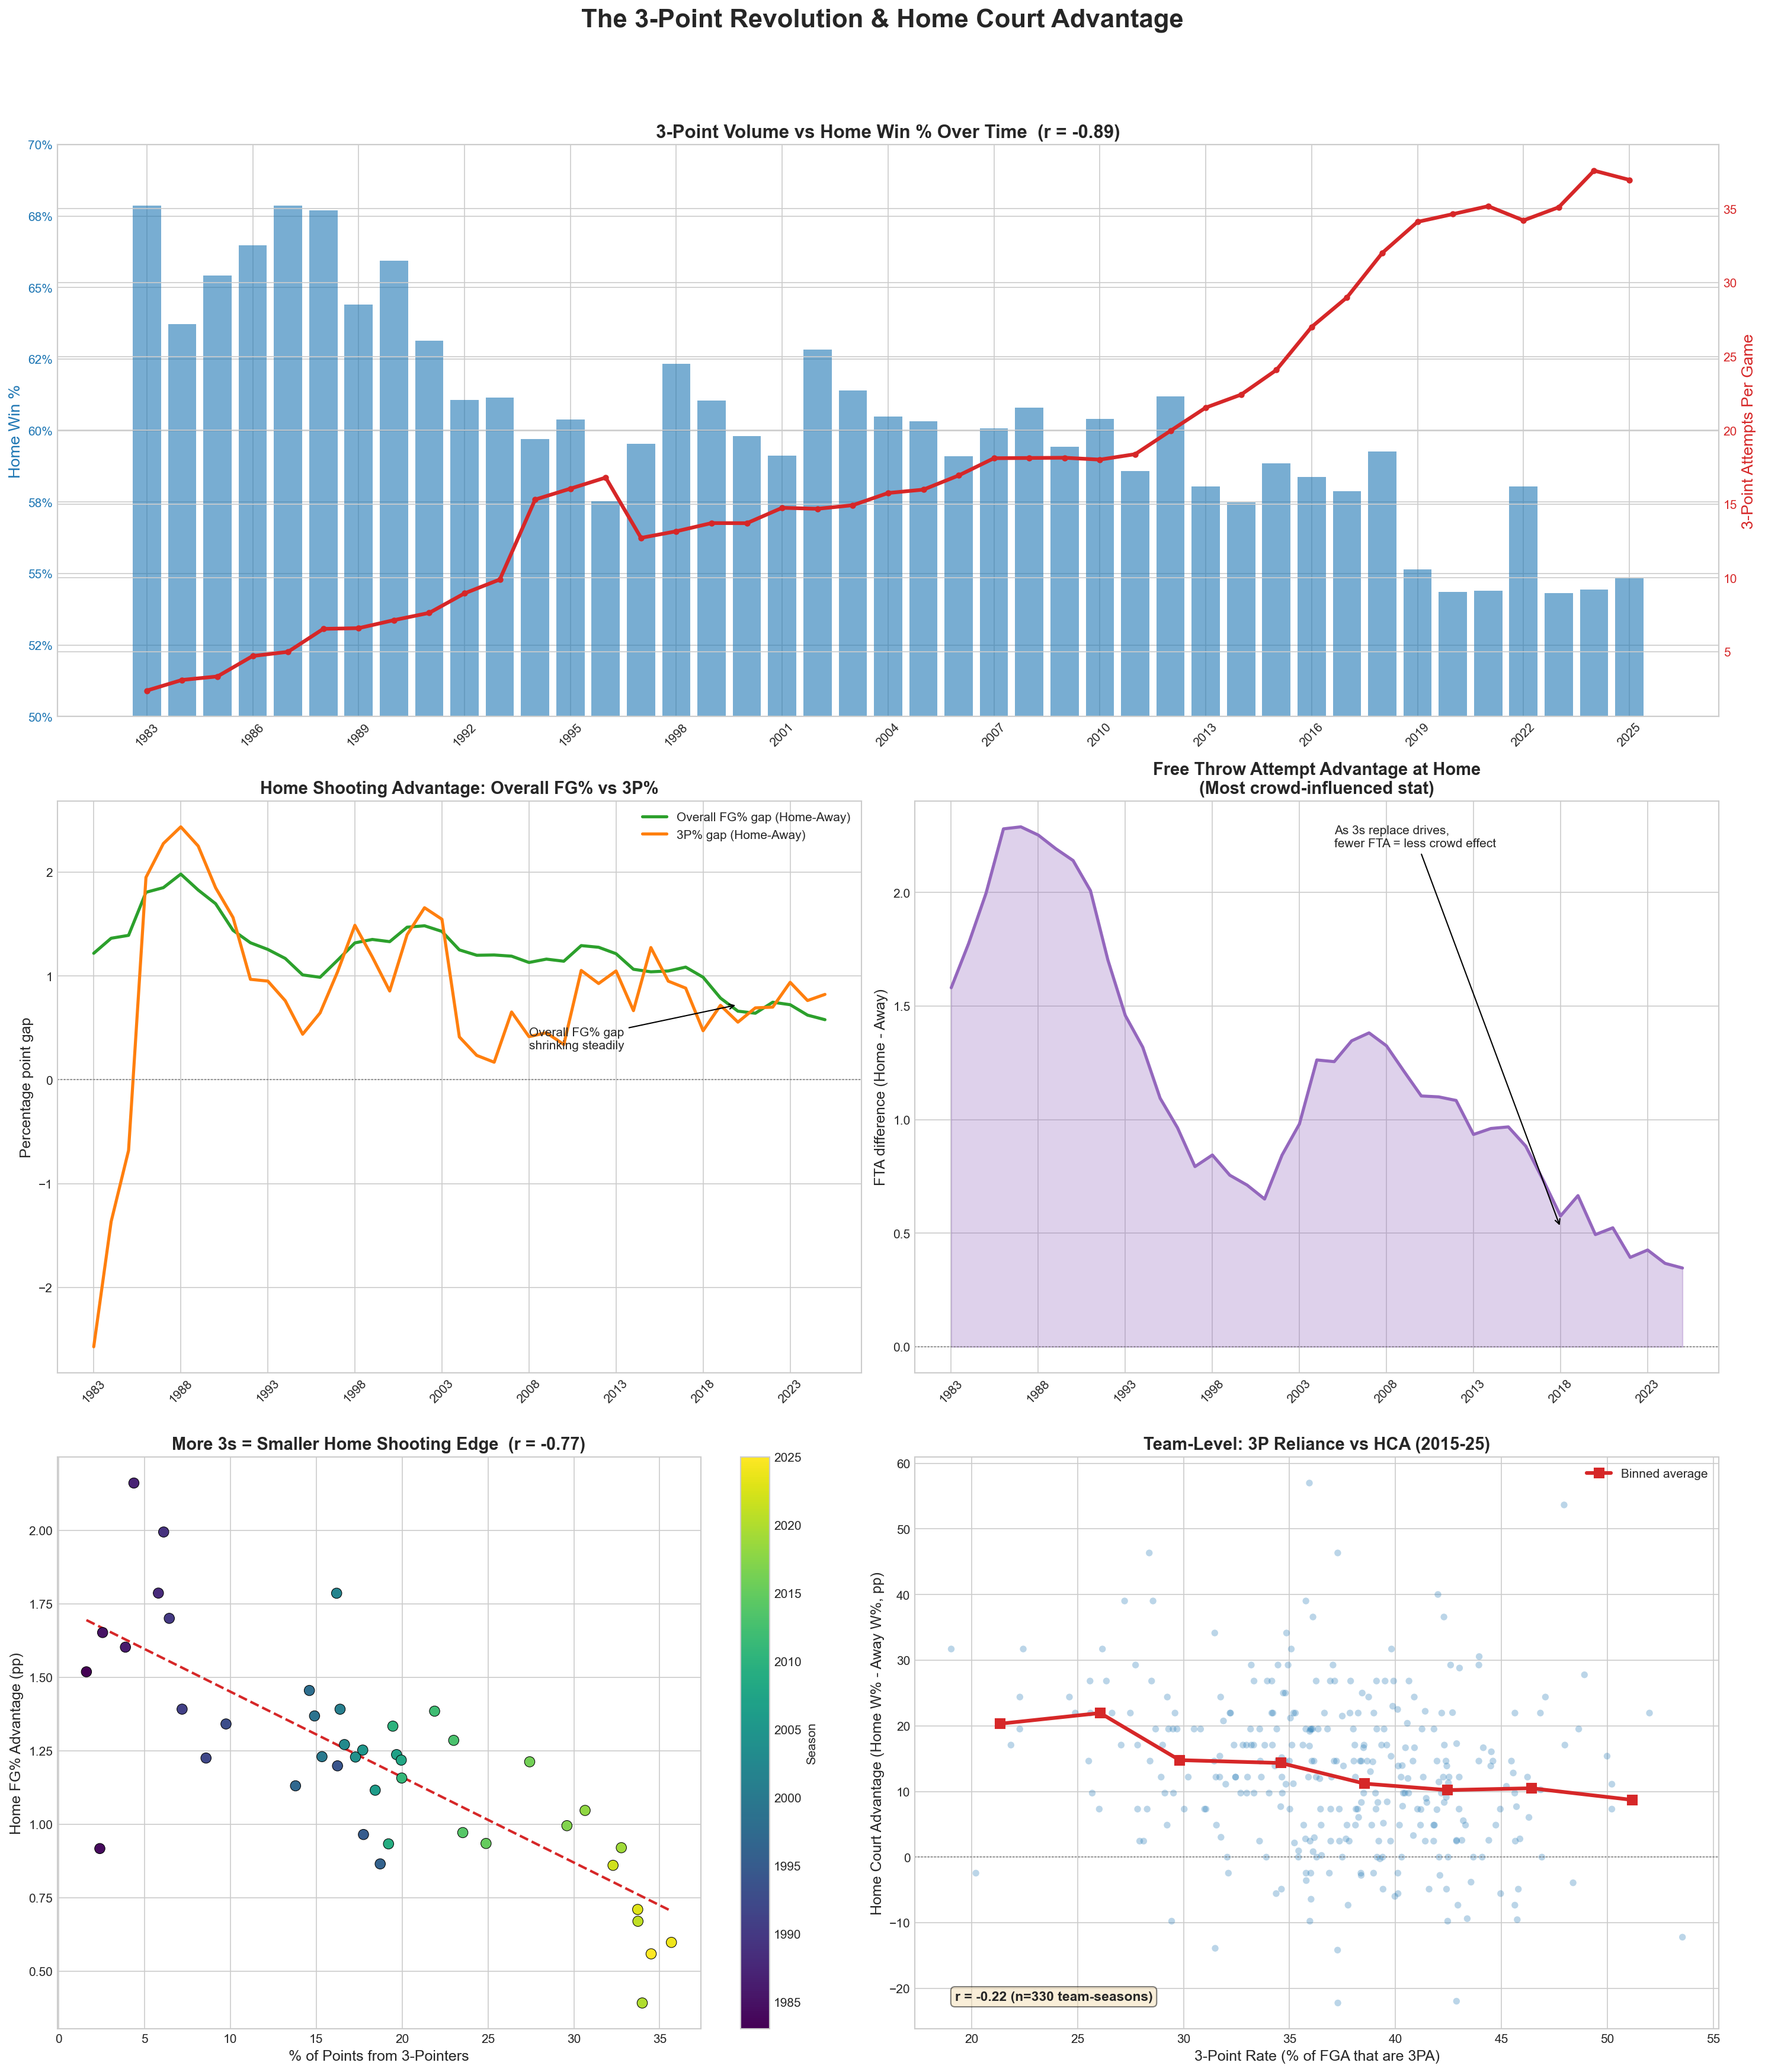
What we found: The correlation between league-wide 3PA and home win% is r = -0.88 — the strongest relationship in this entire investigation. As 3-point attempts went from 2.4 per game in 1983 to 37.6 in 2025, home win% fell from 68% to 55%.
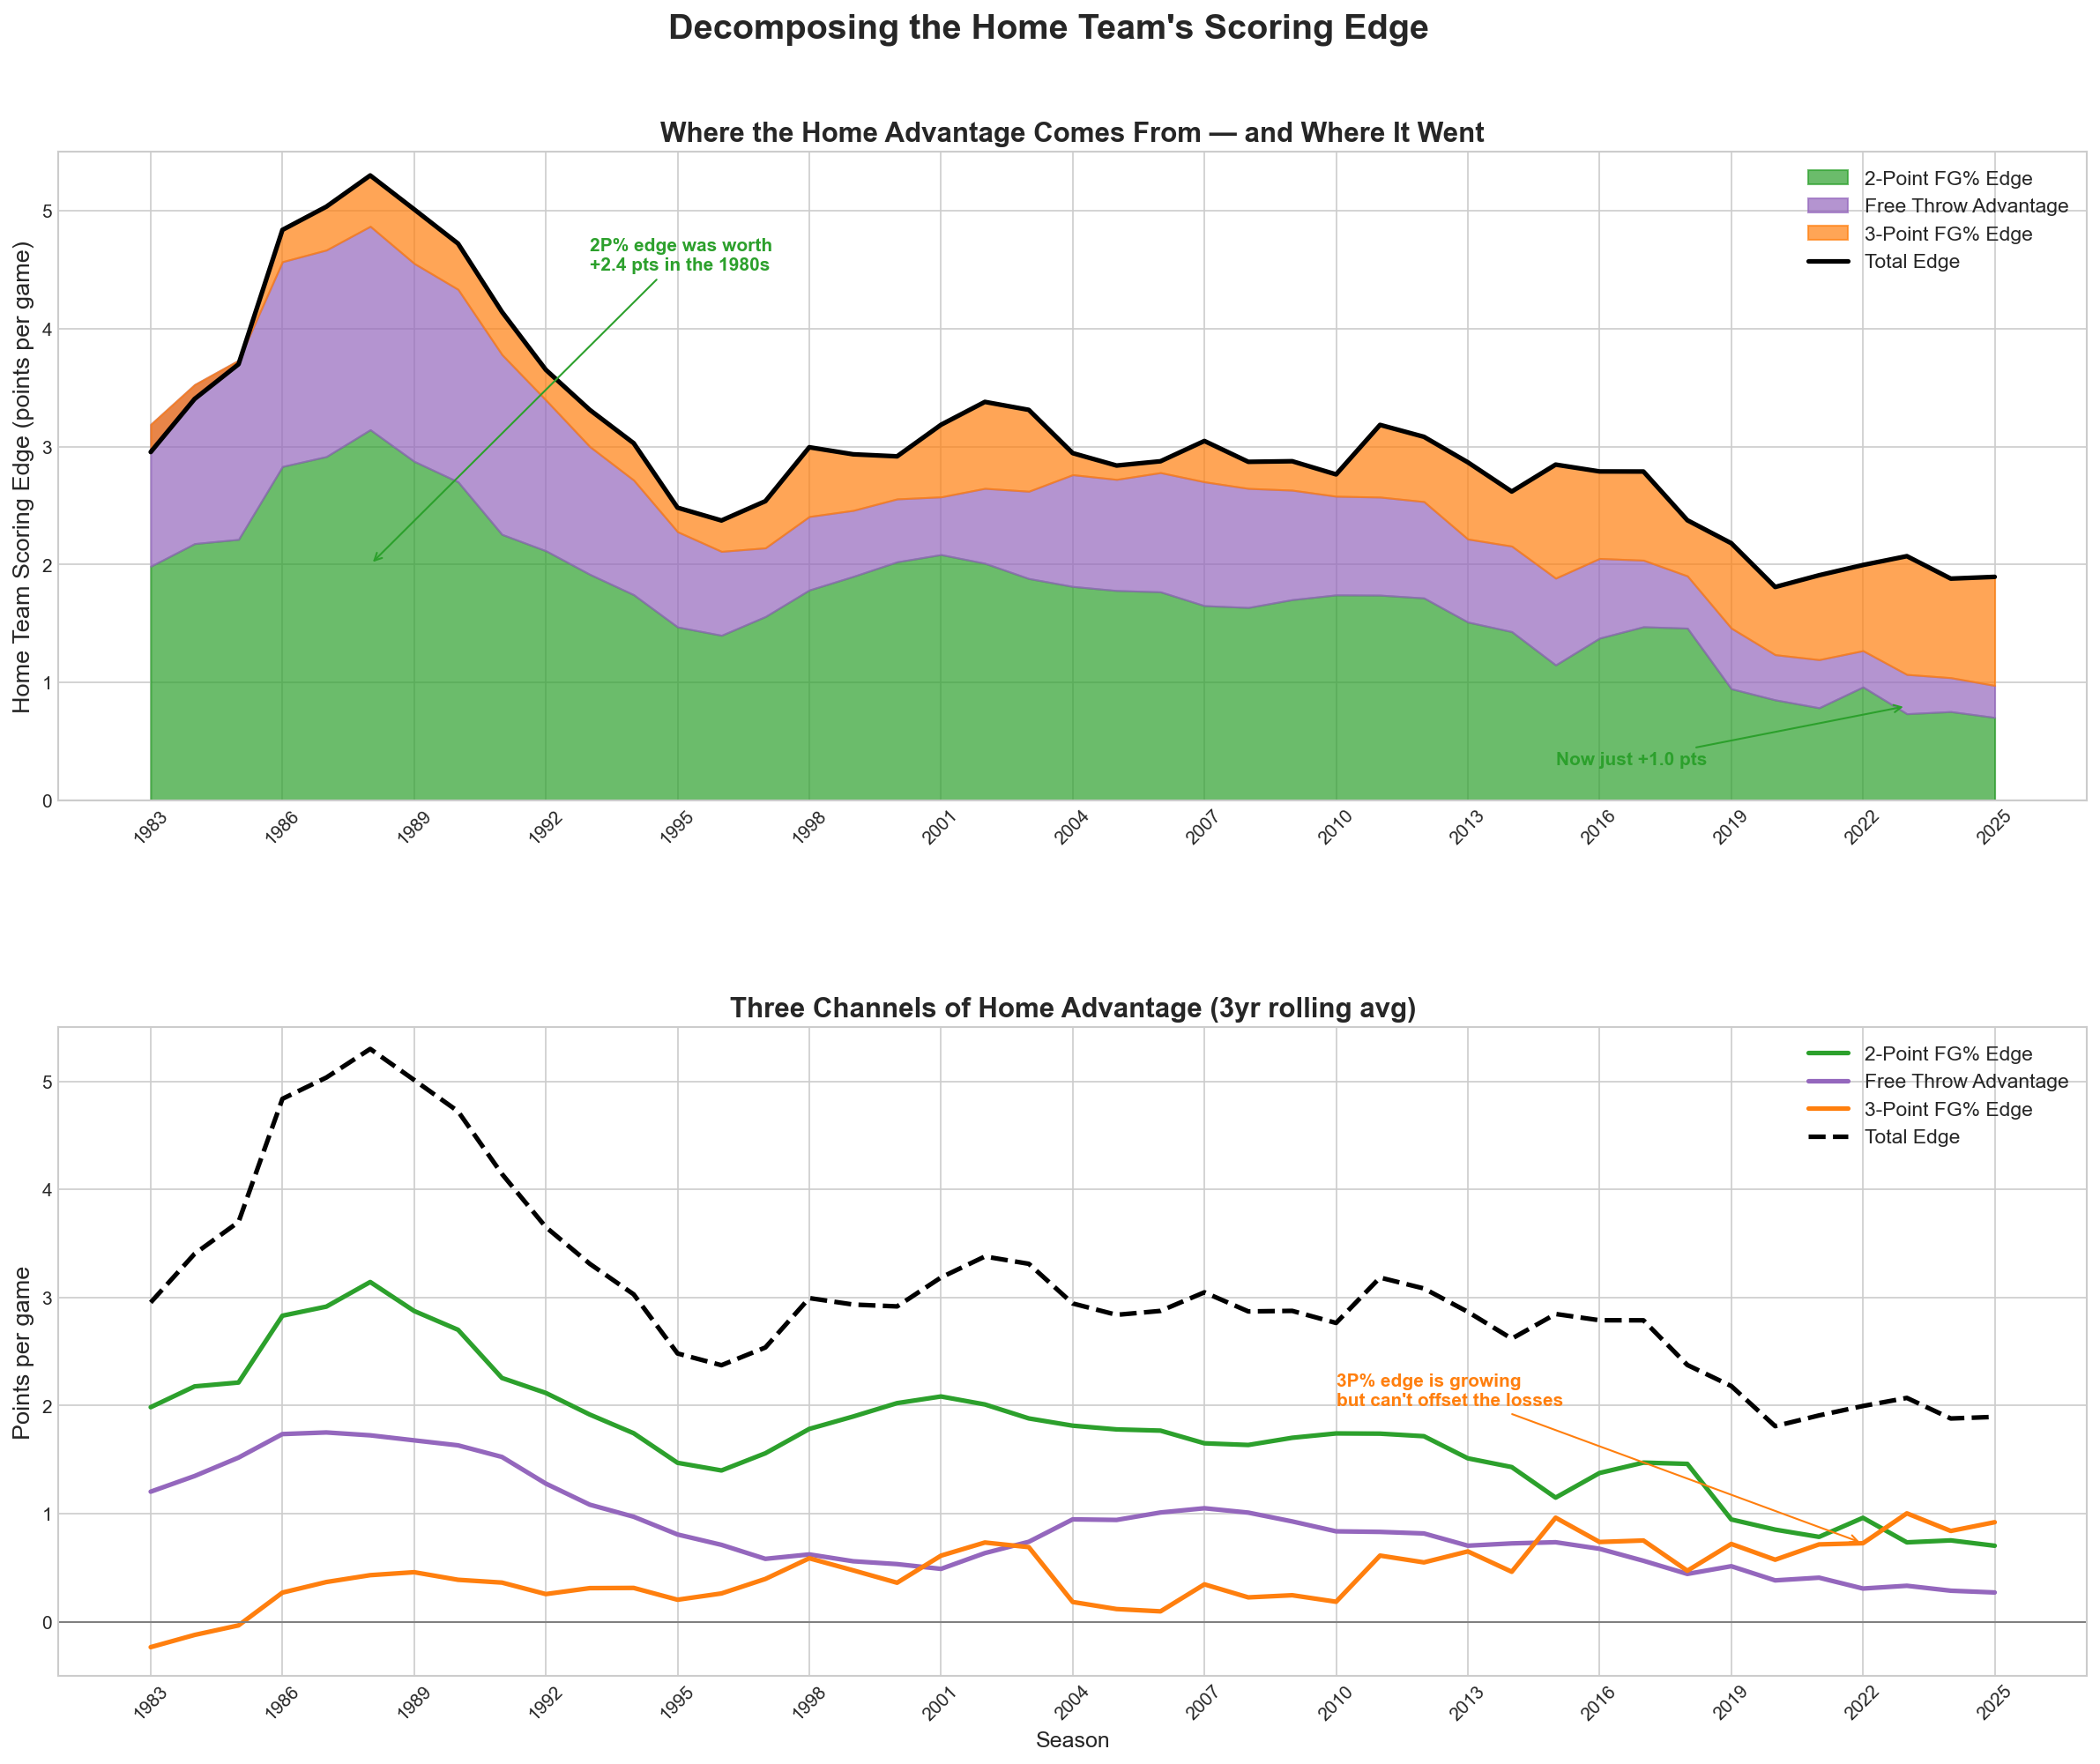
To understand how the 3-pointer erodes HCA, we can decompose the home team’s total scoring edge into three channels: the 2-point FG% advantage, the free throw advantage, and the 3-point FG% advantage. Each channel converts a shooting gap into actual points per game.
| Channel | 1983–94 | 2015–25 | Change |
|---|---|---|---|
| 2-Point FG% edge (+1.5 pp × 80 2PA × 2) | +2.42 pts | +1.02 pts | -1.40 pts |
| Free throw advantage (+1.9 FTA × 76%) | +1.45 pts | +0.45 pts | -1.00 pts |
| 3-Point FG% edge (+0.8 pp × 33 3PA × 3) | +0.23 pts | +0.78 pts | +0.55 pts |
| Total home scoring edge | +4.09 pts | +2.25 pts | -1.84 pts |
The biggest single factor is the 2-point shooting edge, which dropped from +2.42 to +1.02 points per game. This happened for two compounding reasons: the 2P% gap itself shrank (from +1.51 pp to +0.93 pp), and teams now take far fewer 2-point shots (80 per game down to 55), so the remaining edge applies to fewer shots. The free throw channel accounts for another 1.0 points lost — meaningful, but secondary to the 2-point collapse.
Ironically, the 3-point FG% edge has actually grown from +0.23 to +0.78 points, because even a small home shooting edge on 33 three-point attempts per game adds up. But it doesn’t come close to offsetting what was lost on 2-pointers and free throws. The net result: the home team’s total scoring edge has been cut nearly in half.
The Within-Season Paradox
A curious finding: while the macro correlation is -0.88, the within-season team-level correlation is near zero (r = -0.03). Does this contradict the theory? No — it’s a textbook example of an ecological effect. Within any given season, the difference between a team shooting 35 3PA and one shooting 40 3PA is noise compared to team quality. But across eras, the shift from 2.4 to 37.6 3PA changed the fundamental nature of basketball for everyone simultaneously.
Verdict: The 3-point revolution is the primary structural driver of the HCA decline. The correlation is massive (r = -0.88), and as we’ll see next, it passes some causal tests as well.
4d. Natural Experiment: The Short 3-Point Line (1994–97)
The test: Correlation isn’t causation. But the NBA inadvertently ran a natural experiment: from 1994–95 through 1996–97, the league shortened the 3-point line from 23′9″ to 22′. If the 3-point theory is correct, this exogenous rule change should have caused a temporary spike in 3PA and a corresponding dip in HCA — with both partially reversing when the line moved back.
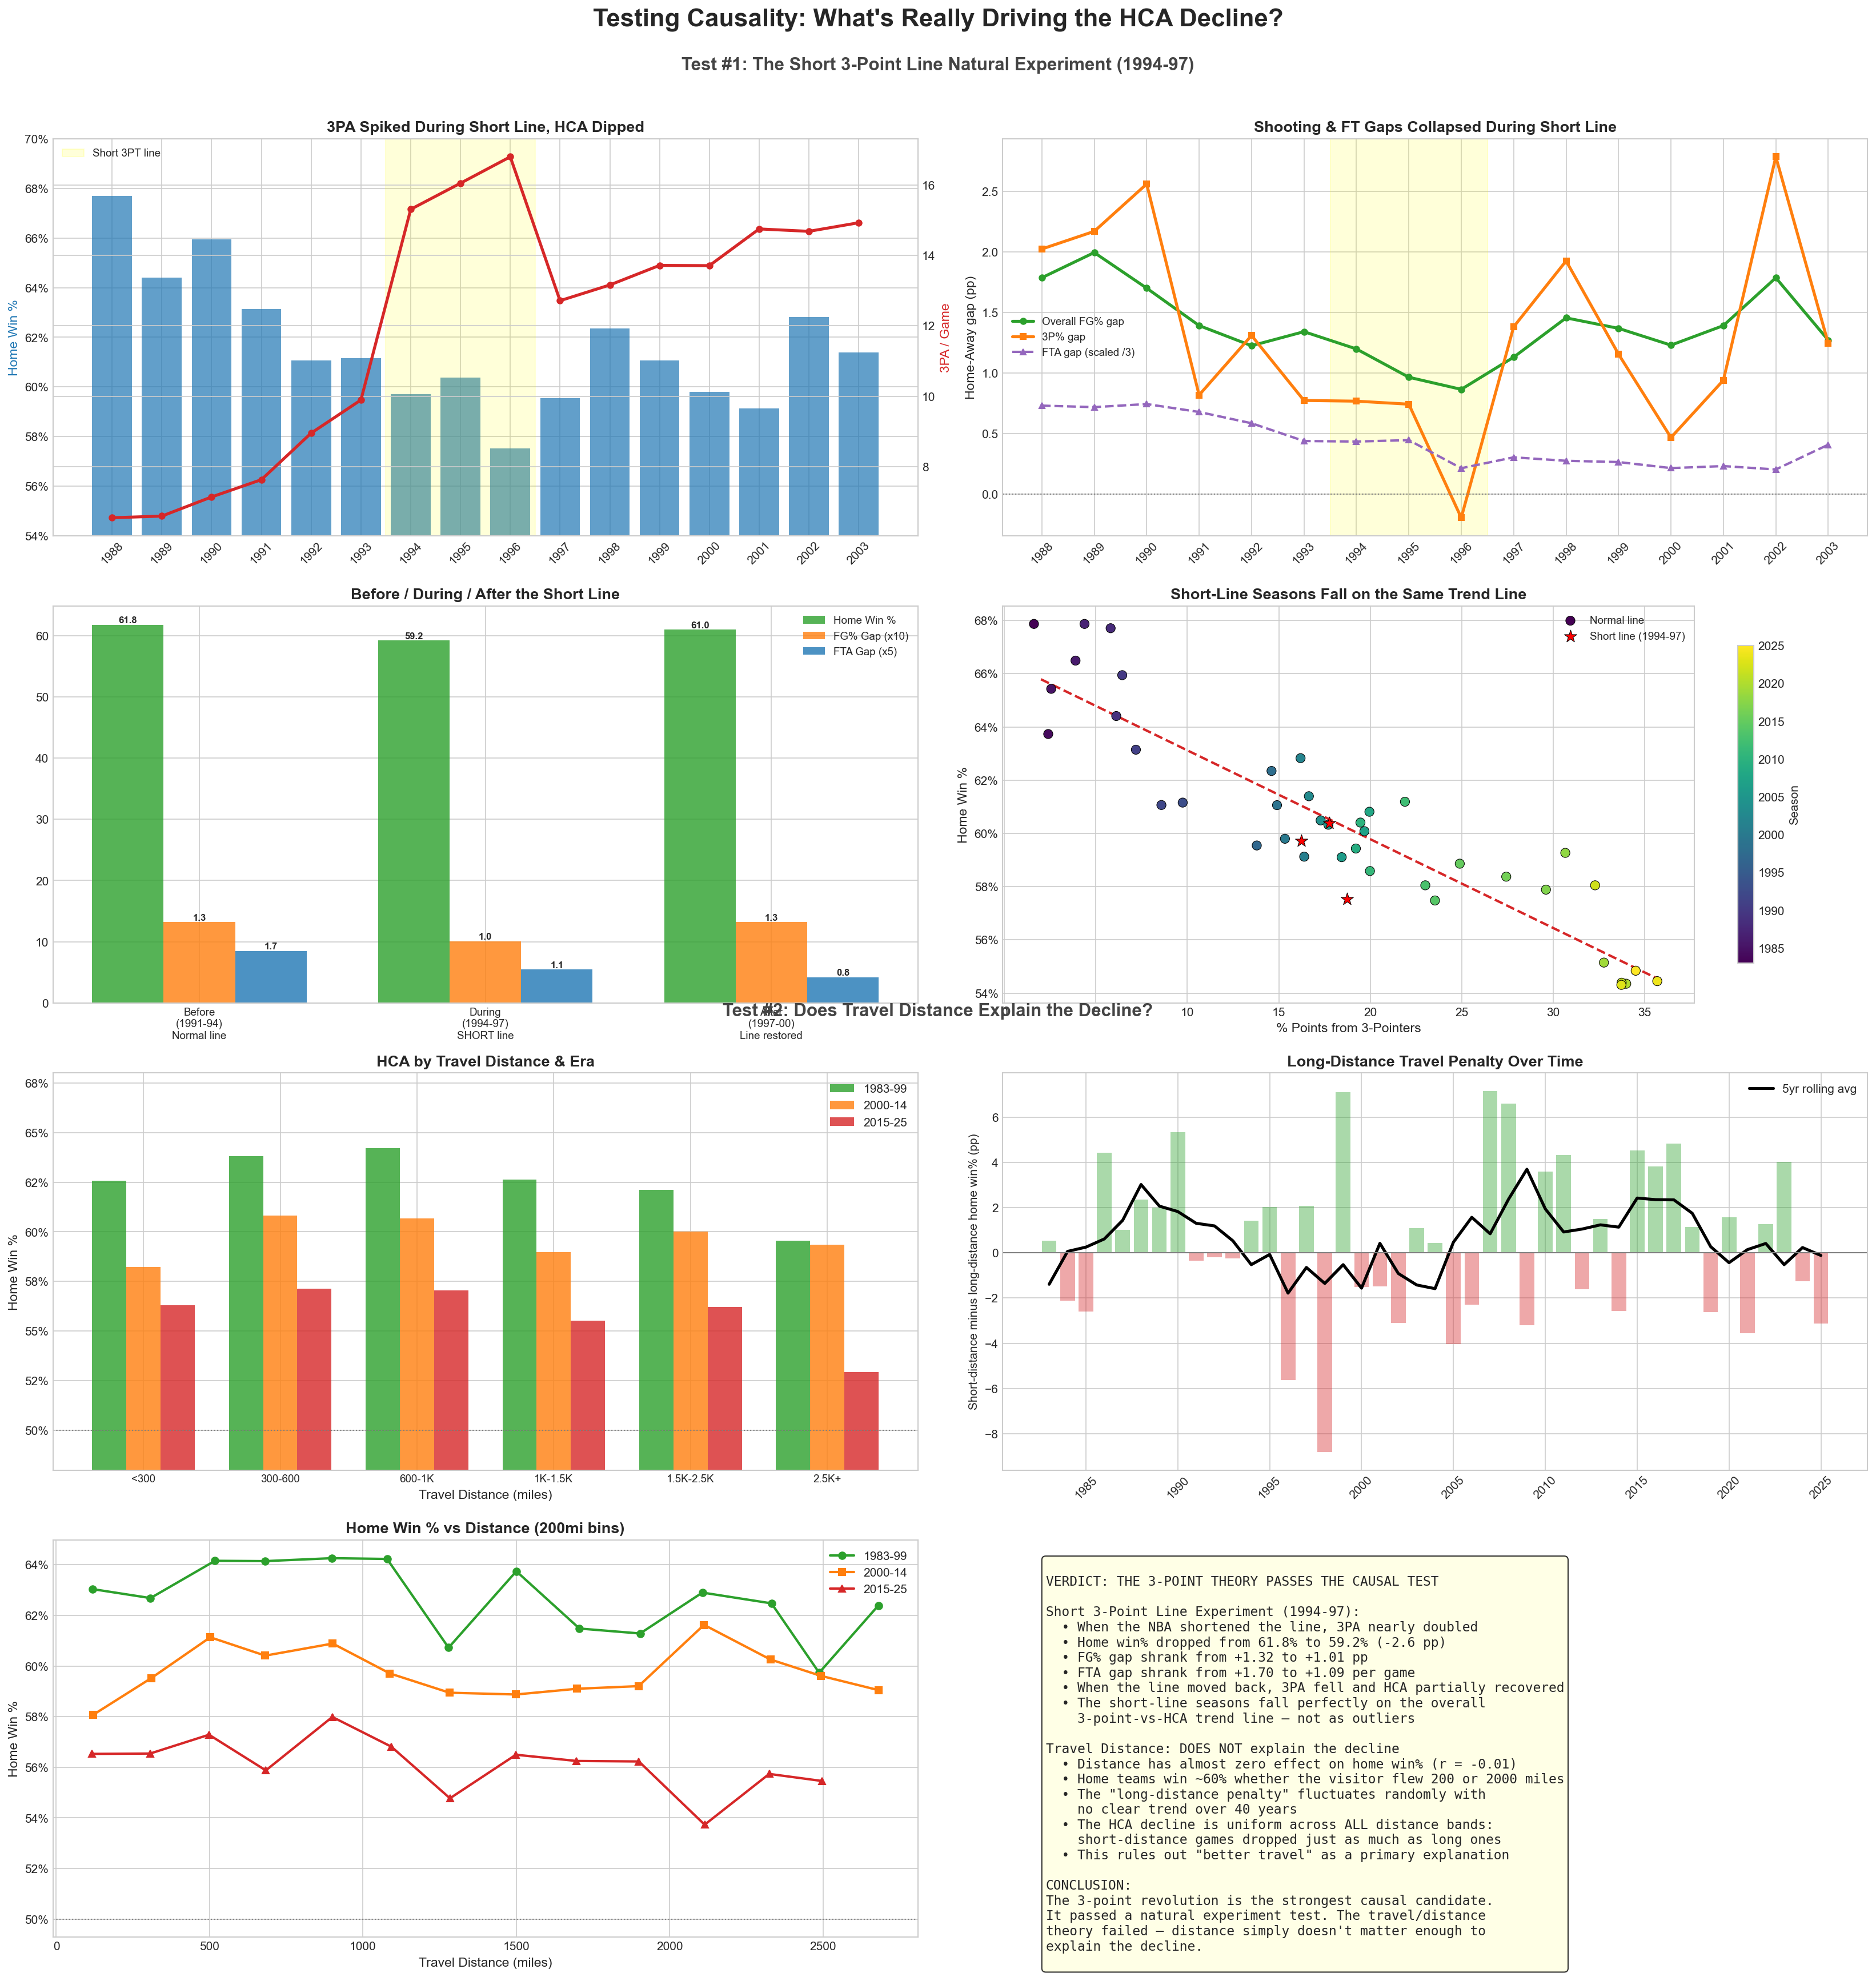
| Period | 3PA/game | Home Win% | FG% Gap | FTA Gap |
|---|---|---|---|---|
| Before (1991–94, normal line) | 8.8 | 61.8% | +1.32 | +1.70 |
| During (1994–97, short line) | 16.1 | 59.2% | +1.01 | +1.09 |
| After (1997–00, line restored) | 13.2 | 60.8% | +1.30 | +0.85 |
What happened: When the line was shortened, 3PA nearly doubled. Home win% dropped 2.6 pp. The FG% gap and FTA gap both shrank. When the line moved back, 3PA dropped and HCA partially recovered. Most compellingly, the short-line seasons fall perfectly on the overall trend line relating 3-point volume to HCA — they aren’t outliers.
Verdict: The 3-point theory passes the causal test. An exogenous rule change that temporarily increased 3-point shooting produced exactly the predicted drop in home court advantage.
4e. Travel Distance
The theory: Improvements in travel (charter flights, better recovery protocols) have made road trips less exhausting, reducing the home team’s advantage.
What we found: Using haversine distances between all NBA arenas, we computed travel distance for every game in the dataset. The result was unambiguous: travel distance has almost no effect on home win probability (r = -0.01). Home teams win ~60% whether the visitor flew 200 miles or 2,000 miles.
Most critically, the HCA decline is uniform across all distance bands:
| Distance | 1983–99 | 2015–25 | Decline |
|---|---|---|---|
| <300 miles | 62.6% | 56.3% | -6.3 pp |
| 300–600 | 63.8% | 57.1% | -6.7 pp |
| 600–1000 | 64.2% | 57.0% | -7.2 pp |
| 1000–1500 | 62.6% | 55.5% | -7.1 pp |
| 1500–2500 | 62.1% | 56.2% | -5.9 pp |
| 2500+ | 59.5% | 52.9% | -6.6 pp |
If better travel were the explanation, long-distance games should have improved the most. They didn’t. Short-distance games dropped just as much.
Verdict: Travel distance is ruled out as a primary explanation. Distance simply doesn’t matter enough in the NBA to explain the decline.
4f. Time Zones & Jet Lag
The theory: Teams crossing time zones, especially traveling eastward (which is harder on circadian rhythm), perform worse. If this effect has diminished over time, it could explain the HCA decline.
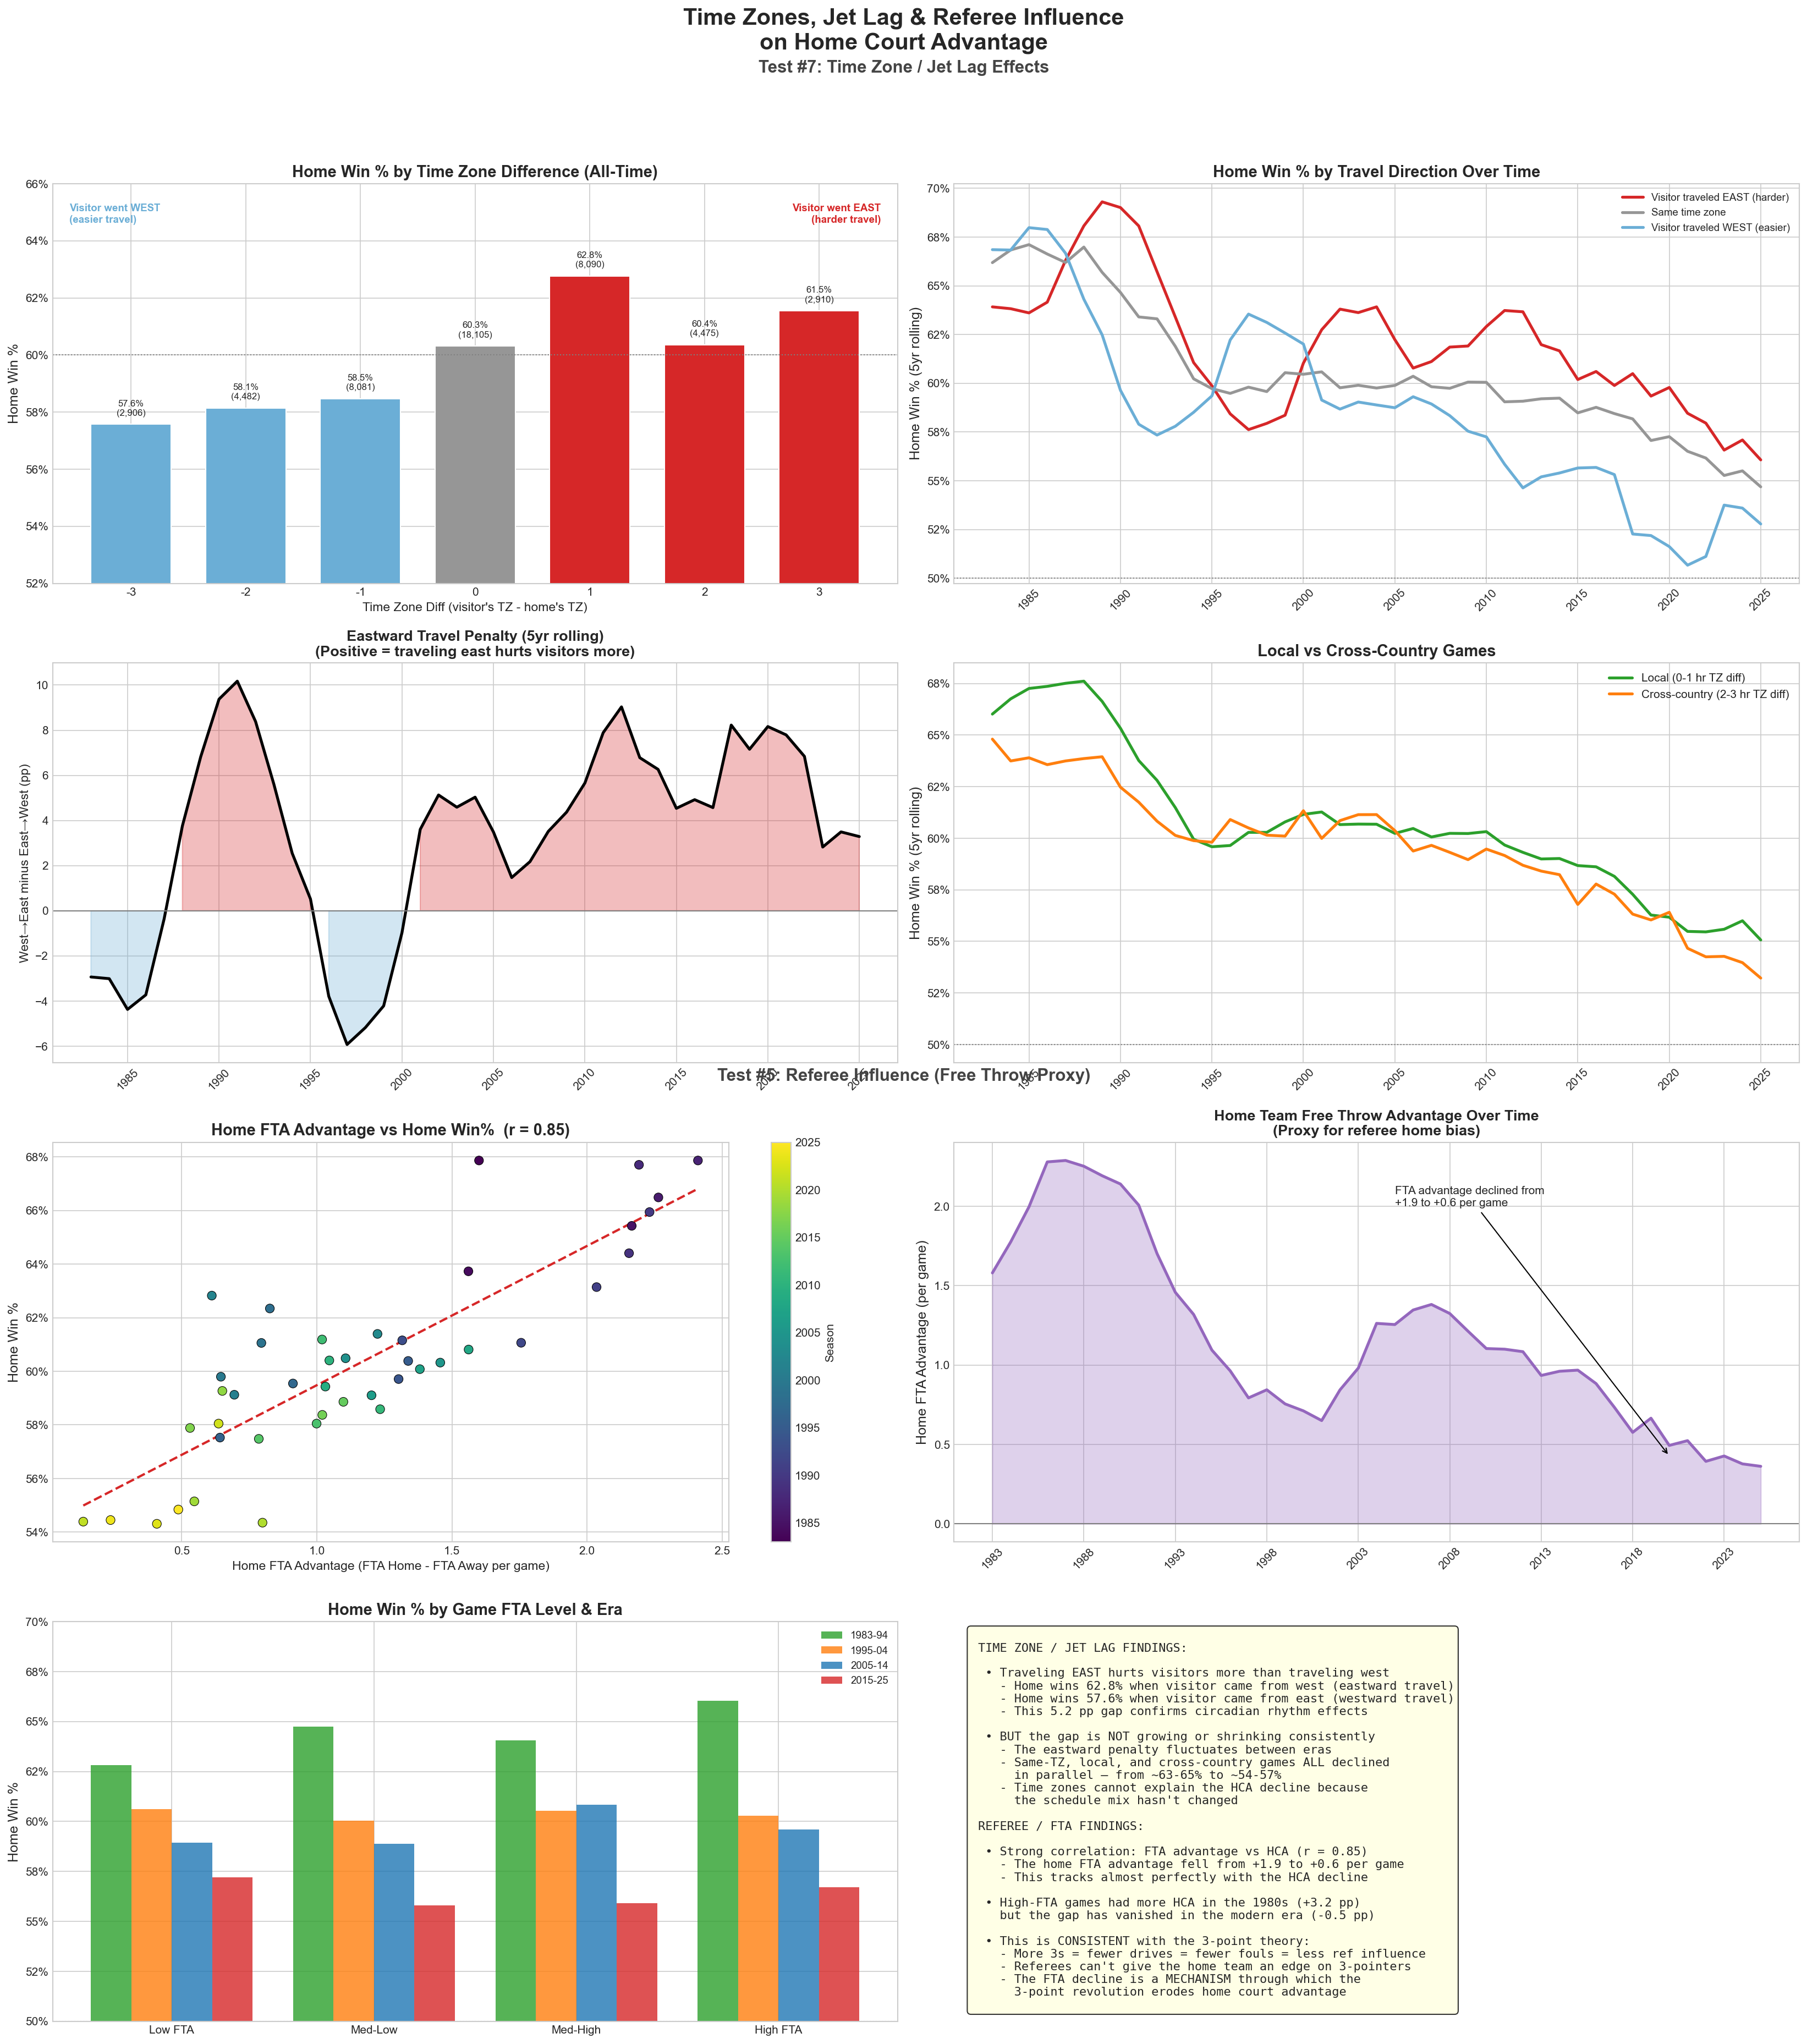
| Visitor Travel Direction | Home Win% | Games |
|---|---|---|
| Visitor traveled west (easier) | 57.6% | 15,469 |
| Same time zone | 60.3% | 18,105 |
| Visitor traveled east (harder) | 62.8% | 15,475 |
What we found: The directional effect is real and significant. When visitors travel east (crossing into an earlier time zone, which disrupts sleep more), home teams win 5.2 pp more than when visitors travel west. This confirms that circadian disruption is a real factor in individual games.
But the effect is not changing over time. The east-west penalty fluctuates randomly across eras. Same-TZ, local, and cross-country games have all declined in parallel. The schedule mix hasn’t changed meaningfully. Time zones explain variation in individual games but cannot explain the historical trend.
Verdict: Jet lag is a real per-game effect (~5 pp for eastward travel) but it does not explain the decline. All time-zone categories dropped at the same rate.
4g. Referee Influence
The theory: Referees, influenced by home crowds, have historically favored home teams through foul calls. If this bias has diminished (through replay review, accountability, or simply fewer fouls), HCA would decline.
We couldn’t access referee assignment data, so we used free throw attempts as a proxy for referee influence on the game. More FTA means more foul calls, which means more opportunity for referee bias to affect the outcome.
What we found: The correlation between home FTA advantage and home win% is r = 0.85 — the second-strongest relationship in the entire investigation.
The home FTA advantage has collapsed:
| Era | Home FTA Advantage | High-FTA vs Low-FTA HCA Gap |
|---|---|---|
| 1983–94 | +1.91 per game | +3.2 pp |
| 1995–04 | +0.88 per game | -0.3 pp |
| 2005–14 | +1.17 per game | +0.7 pp |
| 2015–25 | +0.59 per game | -0.5 pp |
In the 1980s, high-FTA games had 3.2 pp more HCA than low-FTA games, showing that referee-heavy games disproportionately benefited the home team. That gap has completely vanished in the modern era.
Verdict: The FTA decline is one of two mechanisms through which the 3-point revolution erodes home court advantage, accounting for about 1.0 points of lost home scoring edge (roughly 40% of the total margin decline). The other, larger mechanism is the collapse of the 2-point FG% edge (-1.4 points), driven by fewer 2-point attempts overall. Together: more 3s → fewer 2-point attempts and fewer drives → less shooting advantage and fewer crowd-influenced foul calls → less home advantage.
4h. International Basketball: The Control Group
The test: If the decline is about general basketball professionalization (better travel, analytics, officiating), European leagues should show a similar decline. If it’s specifically about the 3-point revolution, leagues that didn’t have a 3-point explosion should retain their HCA. The EuroLeague provides the perfect control group.
We pulled 4,638 games and 9,276 box scores from the EuroLeague API spanning 2007–2025.
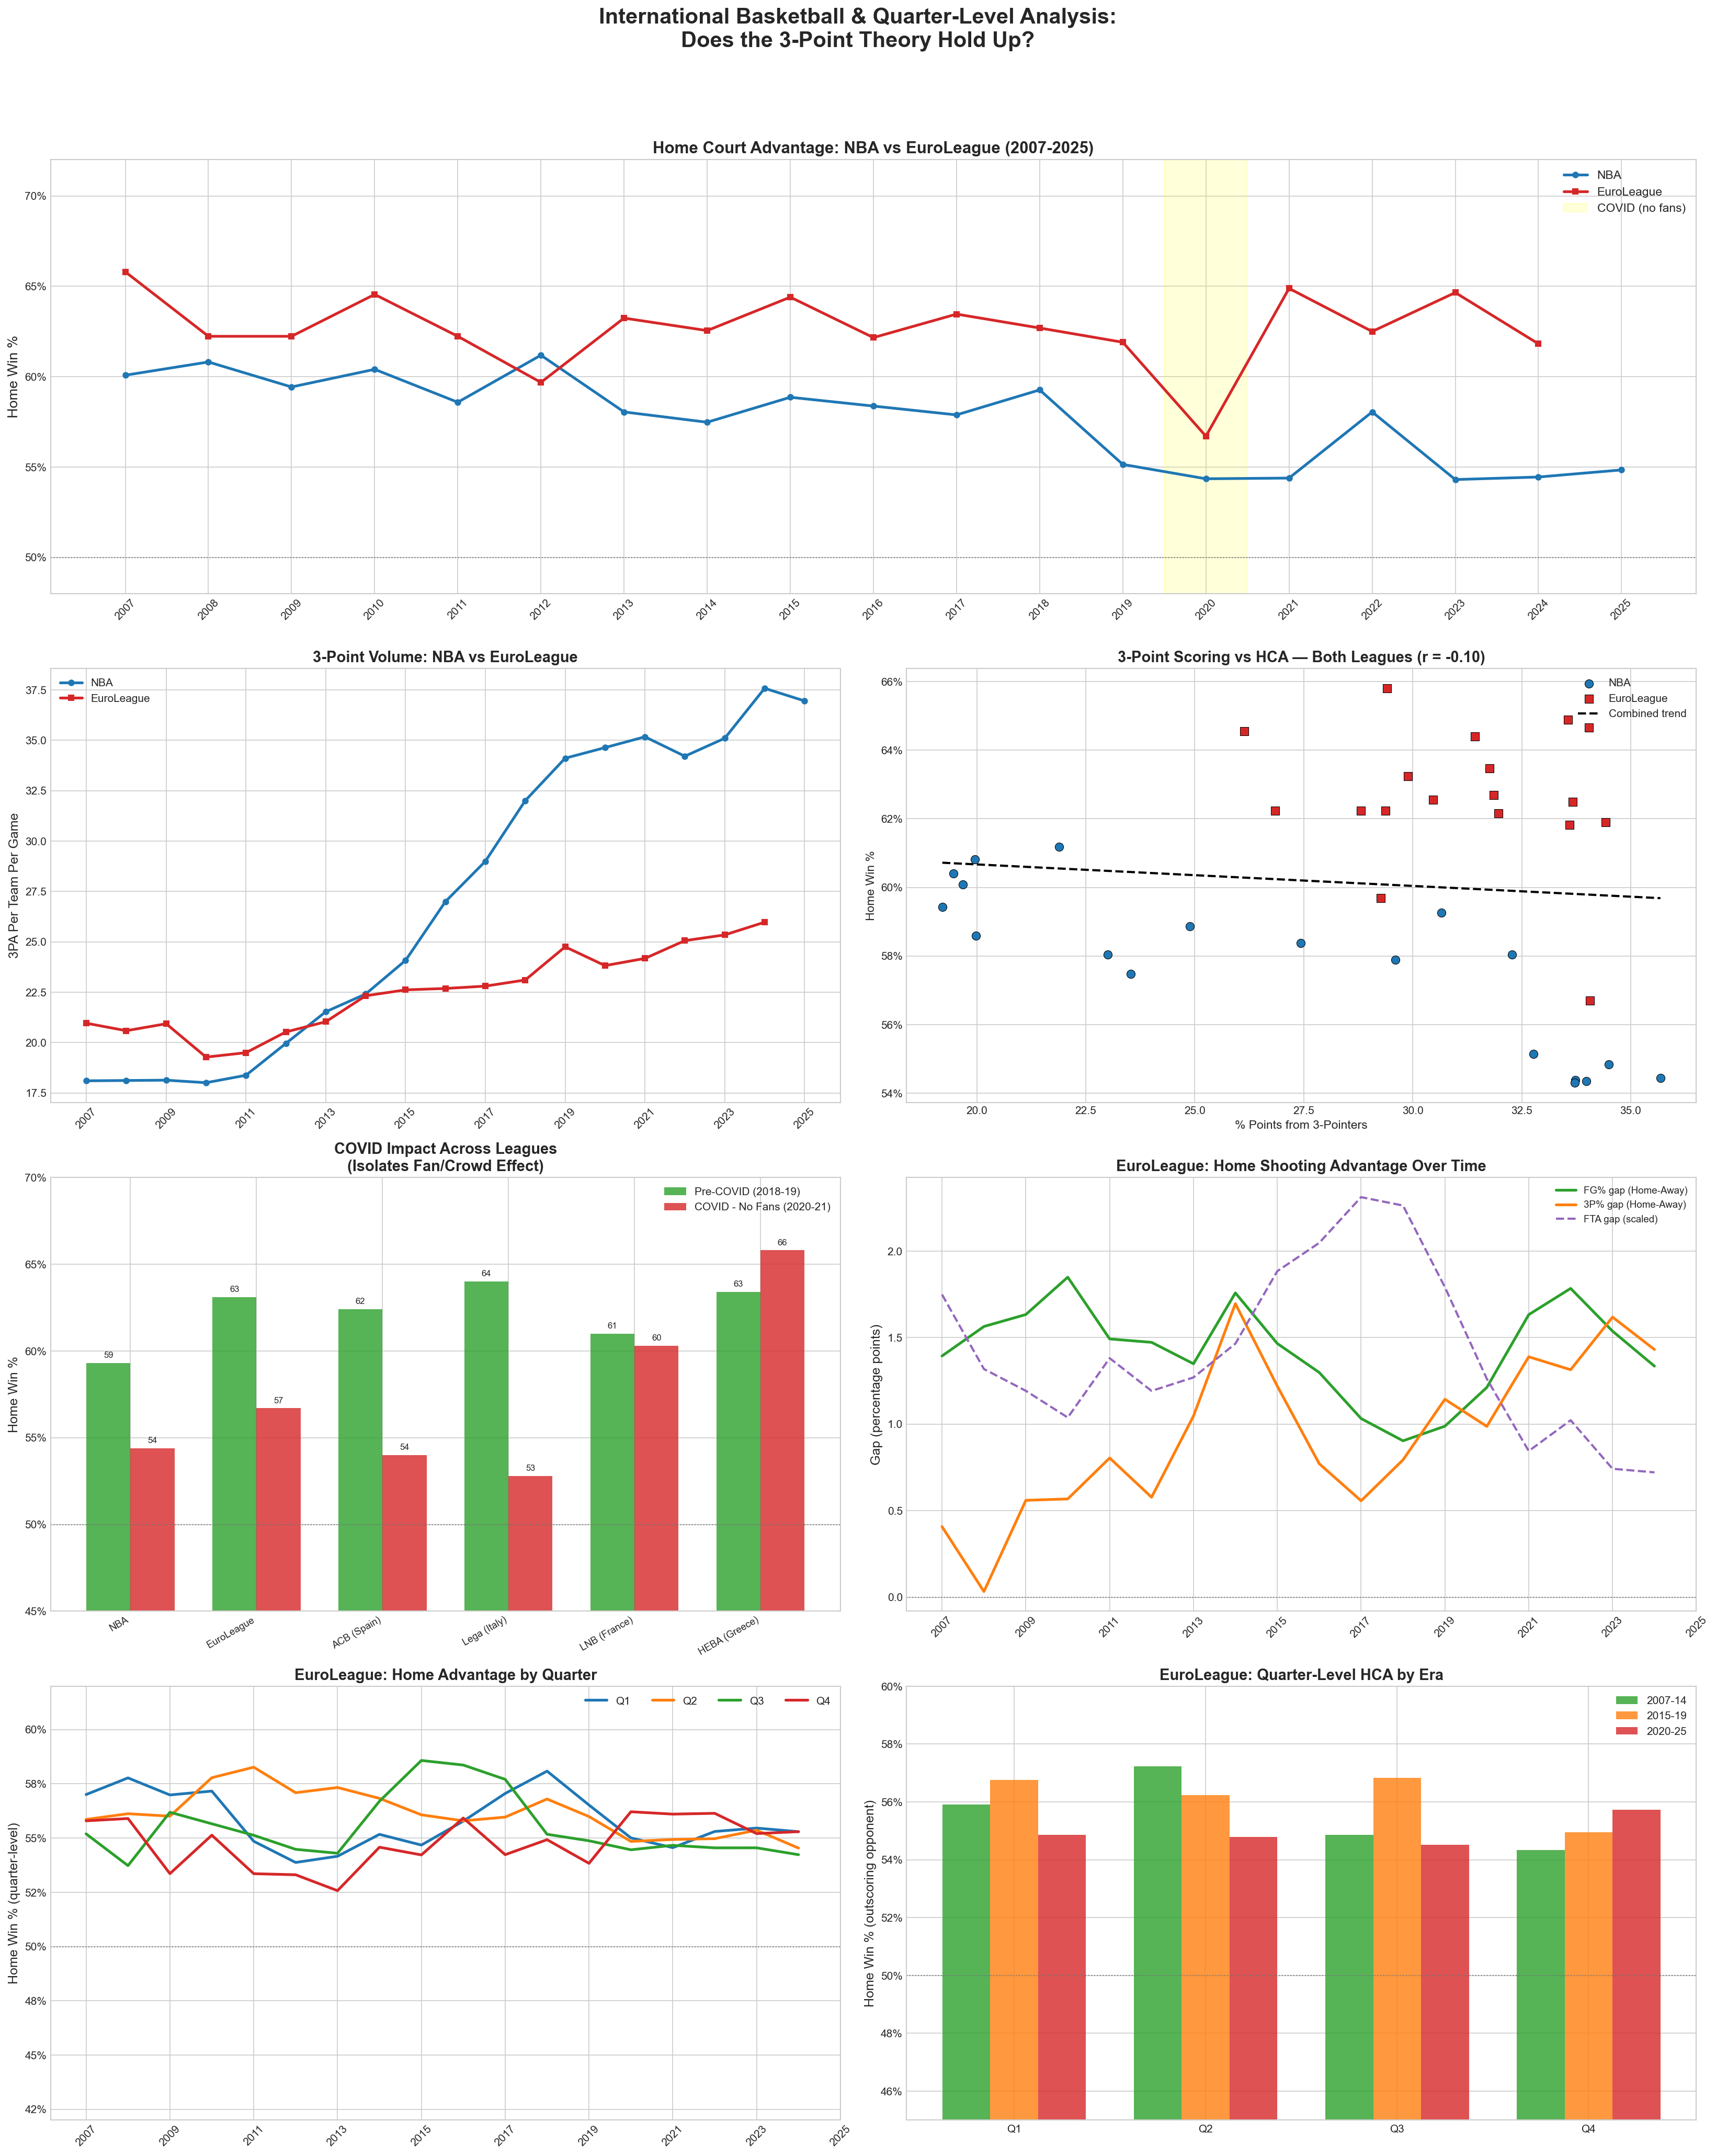
| Metric | NBA | EuroLeague |
|---|---|---|
| 3PA increase (2007–2024) | +19.5 (18→38) | +5.0 (21→26) |
| HCA decline (2007–2024) | -4.4 pp | -0.7 pp |
| 3pt% vs HCA correlation | r = -0.85 | r = -0.19 (n.s.) |
The results are striking: The NBA’s 3-point volume nearly doubled and HCA dropped 4.4 pp. The EuroLeague’s 3-point volume barely changed and HCA barely moved. Both leagues experienced the same improvements in travel, analytics, and officiating during this period. Both were equally affected by COVID (NBA: 54.4%, EuroLeague: 56.7% during empty arenas). But only the league with the 3-point explosion lost its home court advantage.
Verdict: This is the most compelling evidence in the entire investigation. Same sport, same era, same general trends in professionalization — but only the league that revolutionized its shot selection lost its home court advantage. The EuroLeague serves as a control group that strongly supports the 3-point theory.
4i. Pace of Play
The theory: The NBA has gotten faster. More possessions per game means more variance in outcomes, which means more upsets, which means more road wins. Faster pace could erode home court advantage.
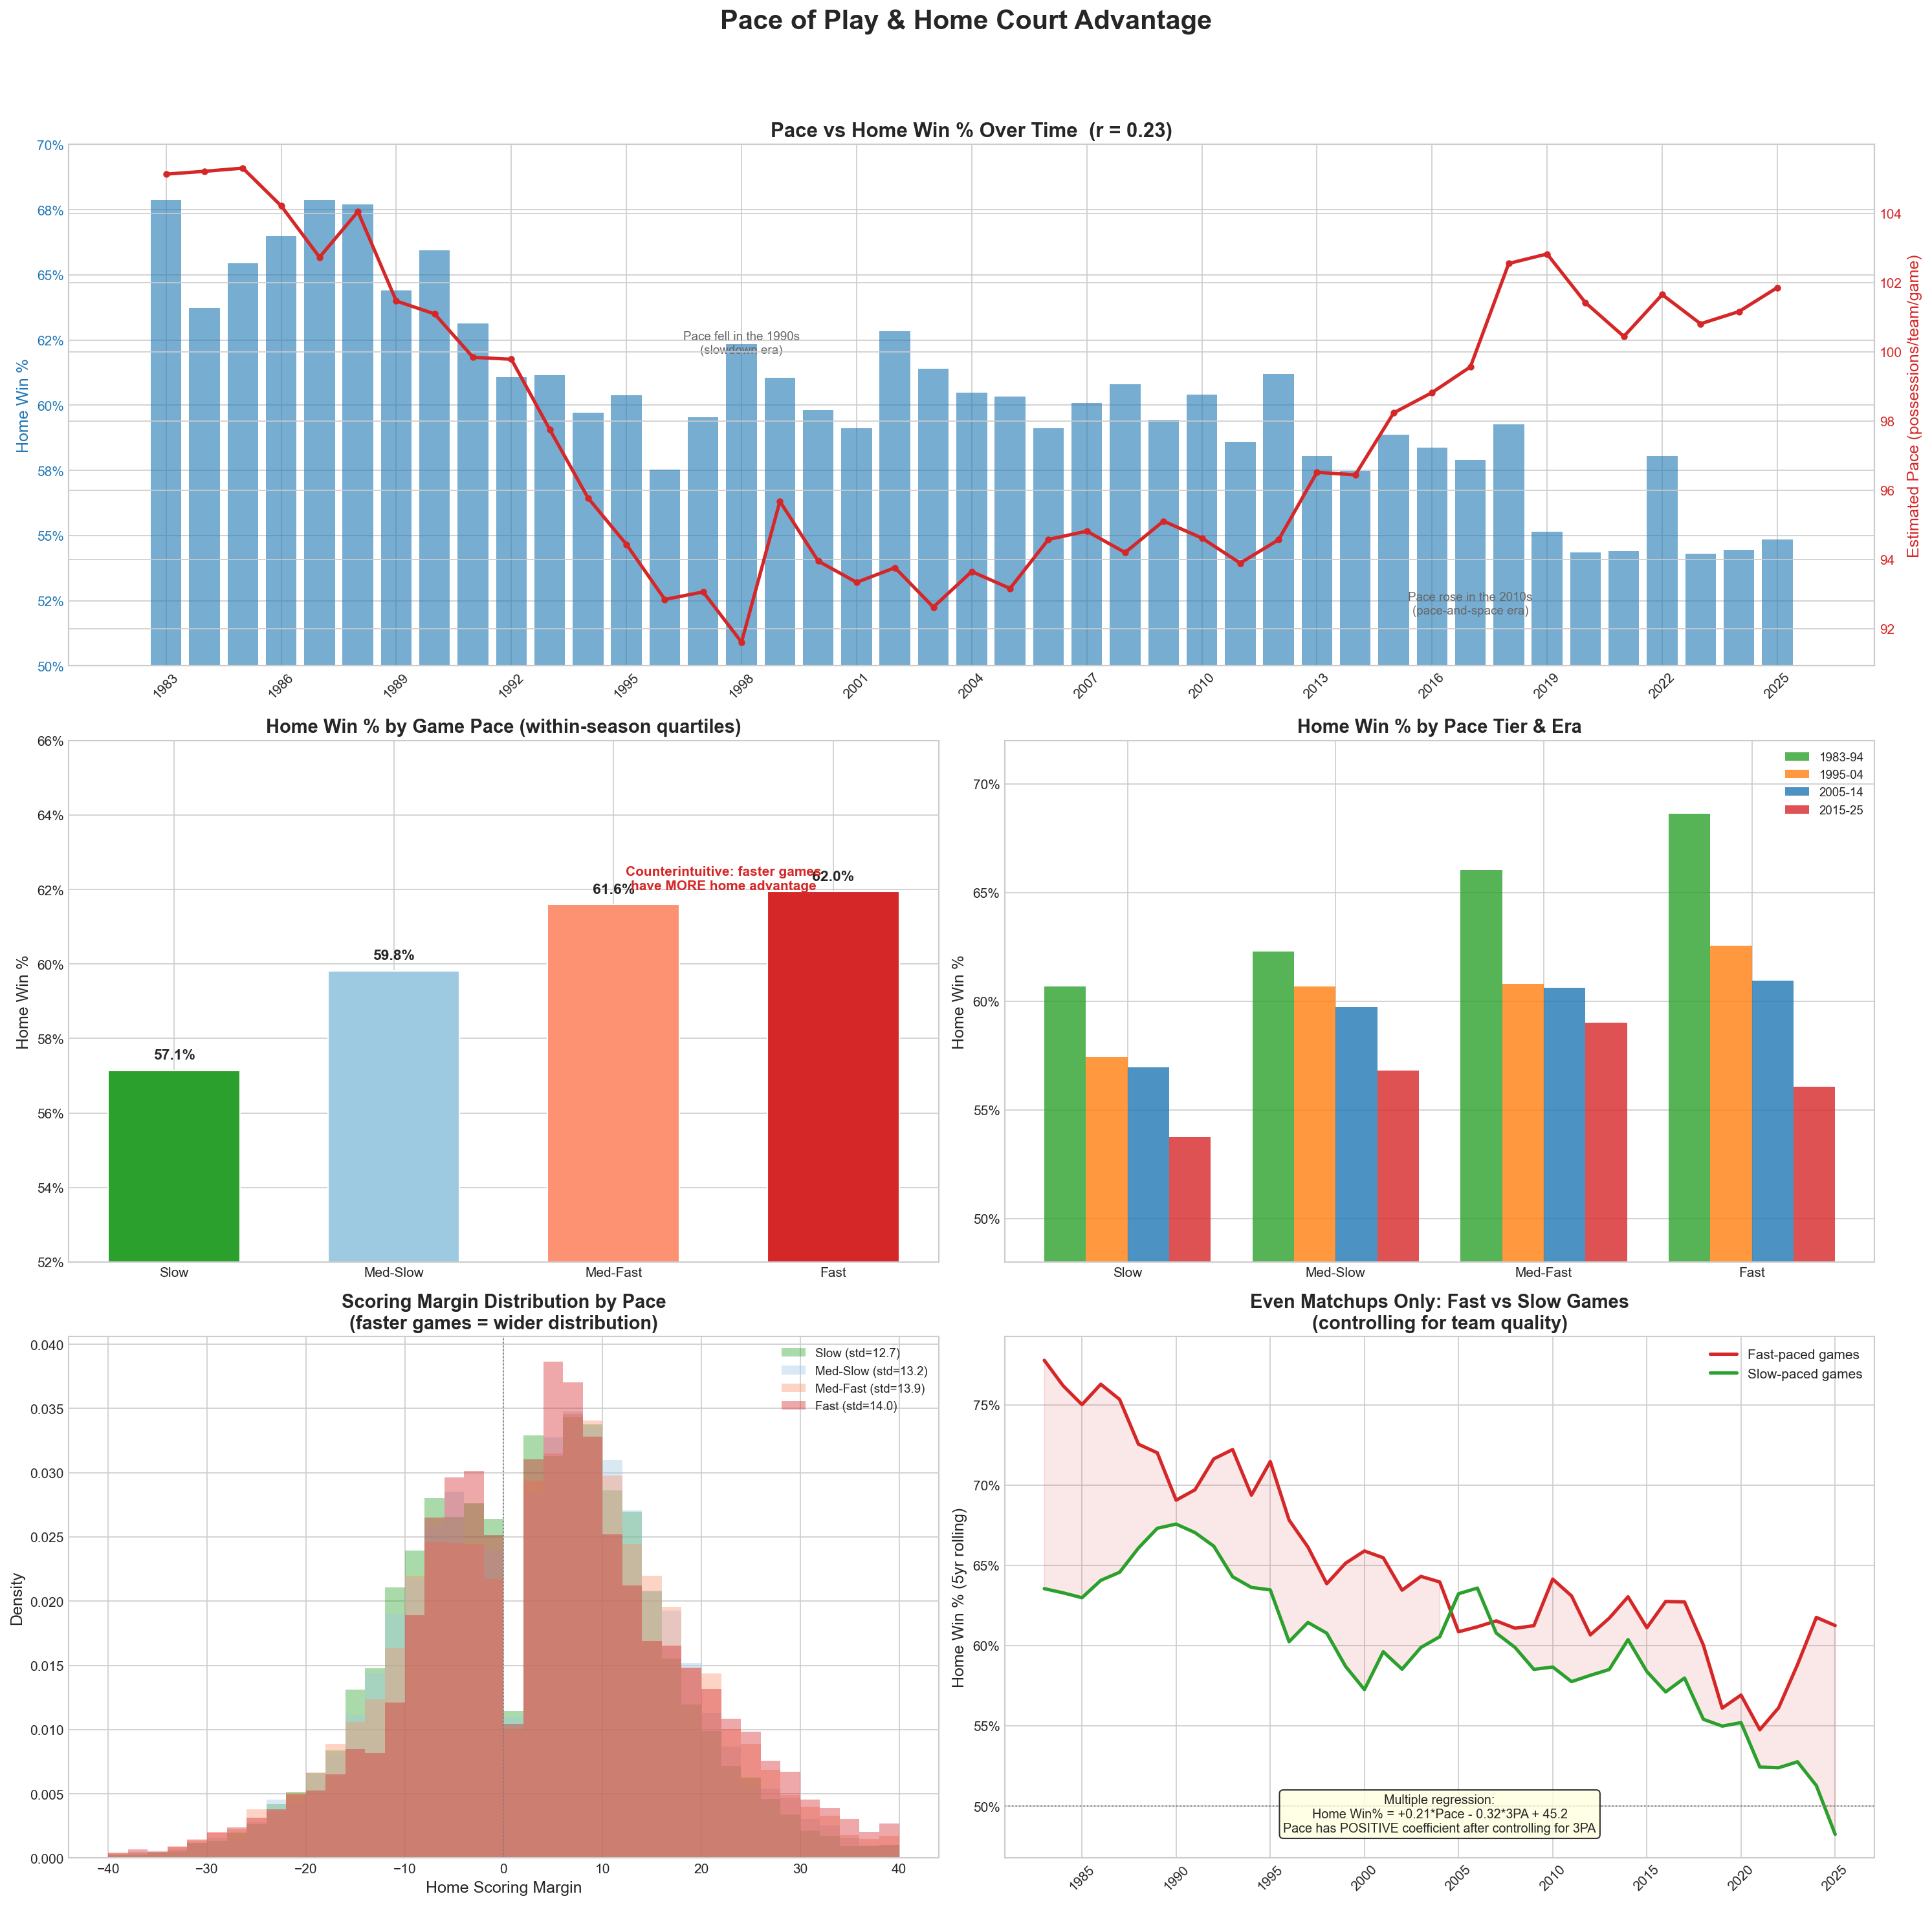
What we found: The theory is intuitive but the data flatly contradicts it. The raw season-level correlation between pace and HCA is weakly positive (r = +0.23) — faster seasons have slightly more home advantage, not less.
The within-game analysis is even more stark:
| Game Pace Tier | Home Win % | Margin Std Dev |
|---|---|---|
| Slow (bottom 25%) | 57.1% | 12.7 |
| Med-Slow | 59.8% | 13.2 |
| Med-Fast | 61.6% | 13.9 |
| Fast (top 25%) | 62.0% | 14.0 |
Fast games do have more variance (margin std of 14.0 vs 12.7), confirming that pace increases randomness. But home teams benefit from that randomness, winning 62.0% in fast games versus just 57.1% in slow games. This +4.9 pp gap holds even when controlling for team quality: in evenly-matched games, fast-paced contests still have higher HCA (64.9%) than slow ones (58.5%).
A possible explanation: good home teams push the pace. They’re energized by the crowd, run in transition, and convert home comfort into fast-break points. Slow games tend to be grind-it-out affairs where the road team controls tempo.
A multiple regression putting both pace and 3PA into the model reveals the relationship clearly:
Home Win% = +0.21 × Pace − 0.32 × 3PA + 45.2
Pace has a positive coefficient: faster pace helps the home team. 3PA has a negative coefficient: more 3-pointers hurt the home team. After controlling for 3PA, pace has actually been masking some of the decline — without the pace increase of the 2010s, HCA might have fallen even further.
Verdict: Pace of play is ruled out as a cause. Faster pace actually increases home advantage, not decreases it. The pace increase of the modern era has been a countervailing force, partially offsetting the 3-point effect.
4j. Seasonal Fatigue & Weekend Crowds
The theories: (1) Home court advantage erodes as the season progresses because players get fatigued and less motivated for regular-season home games. (2) Weekend games, which draw bigger and louder crowds, should have more home advantage than quiet weeknight games.
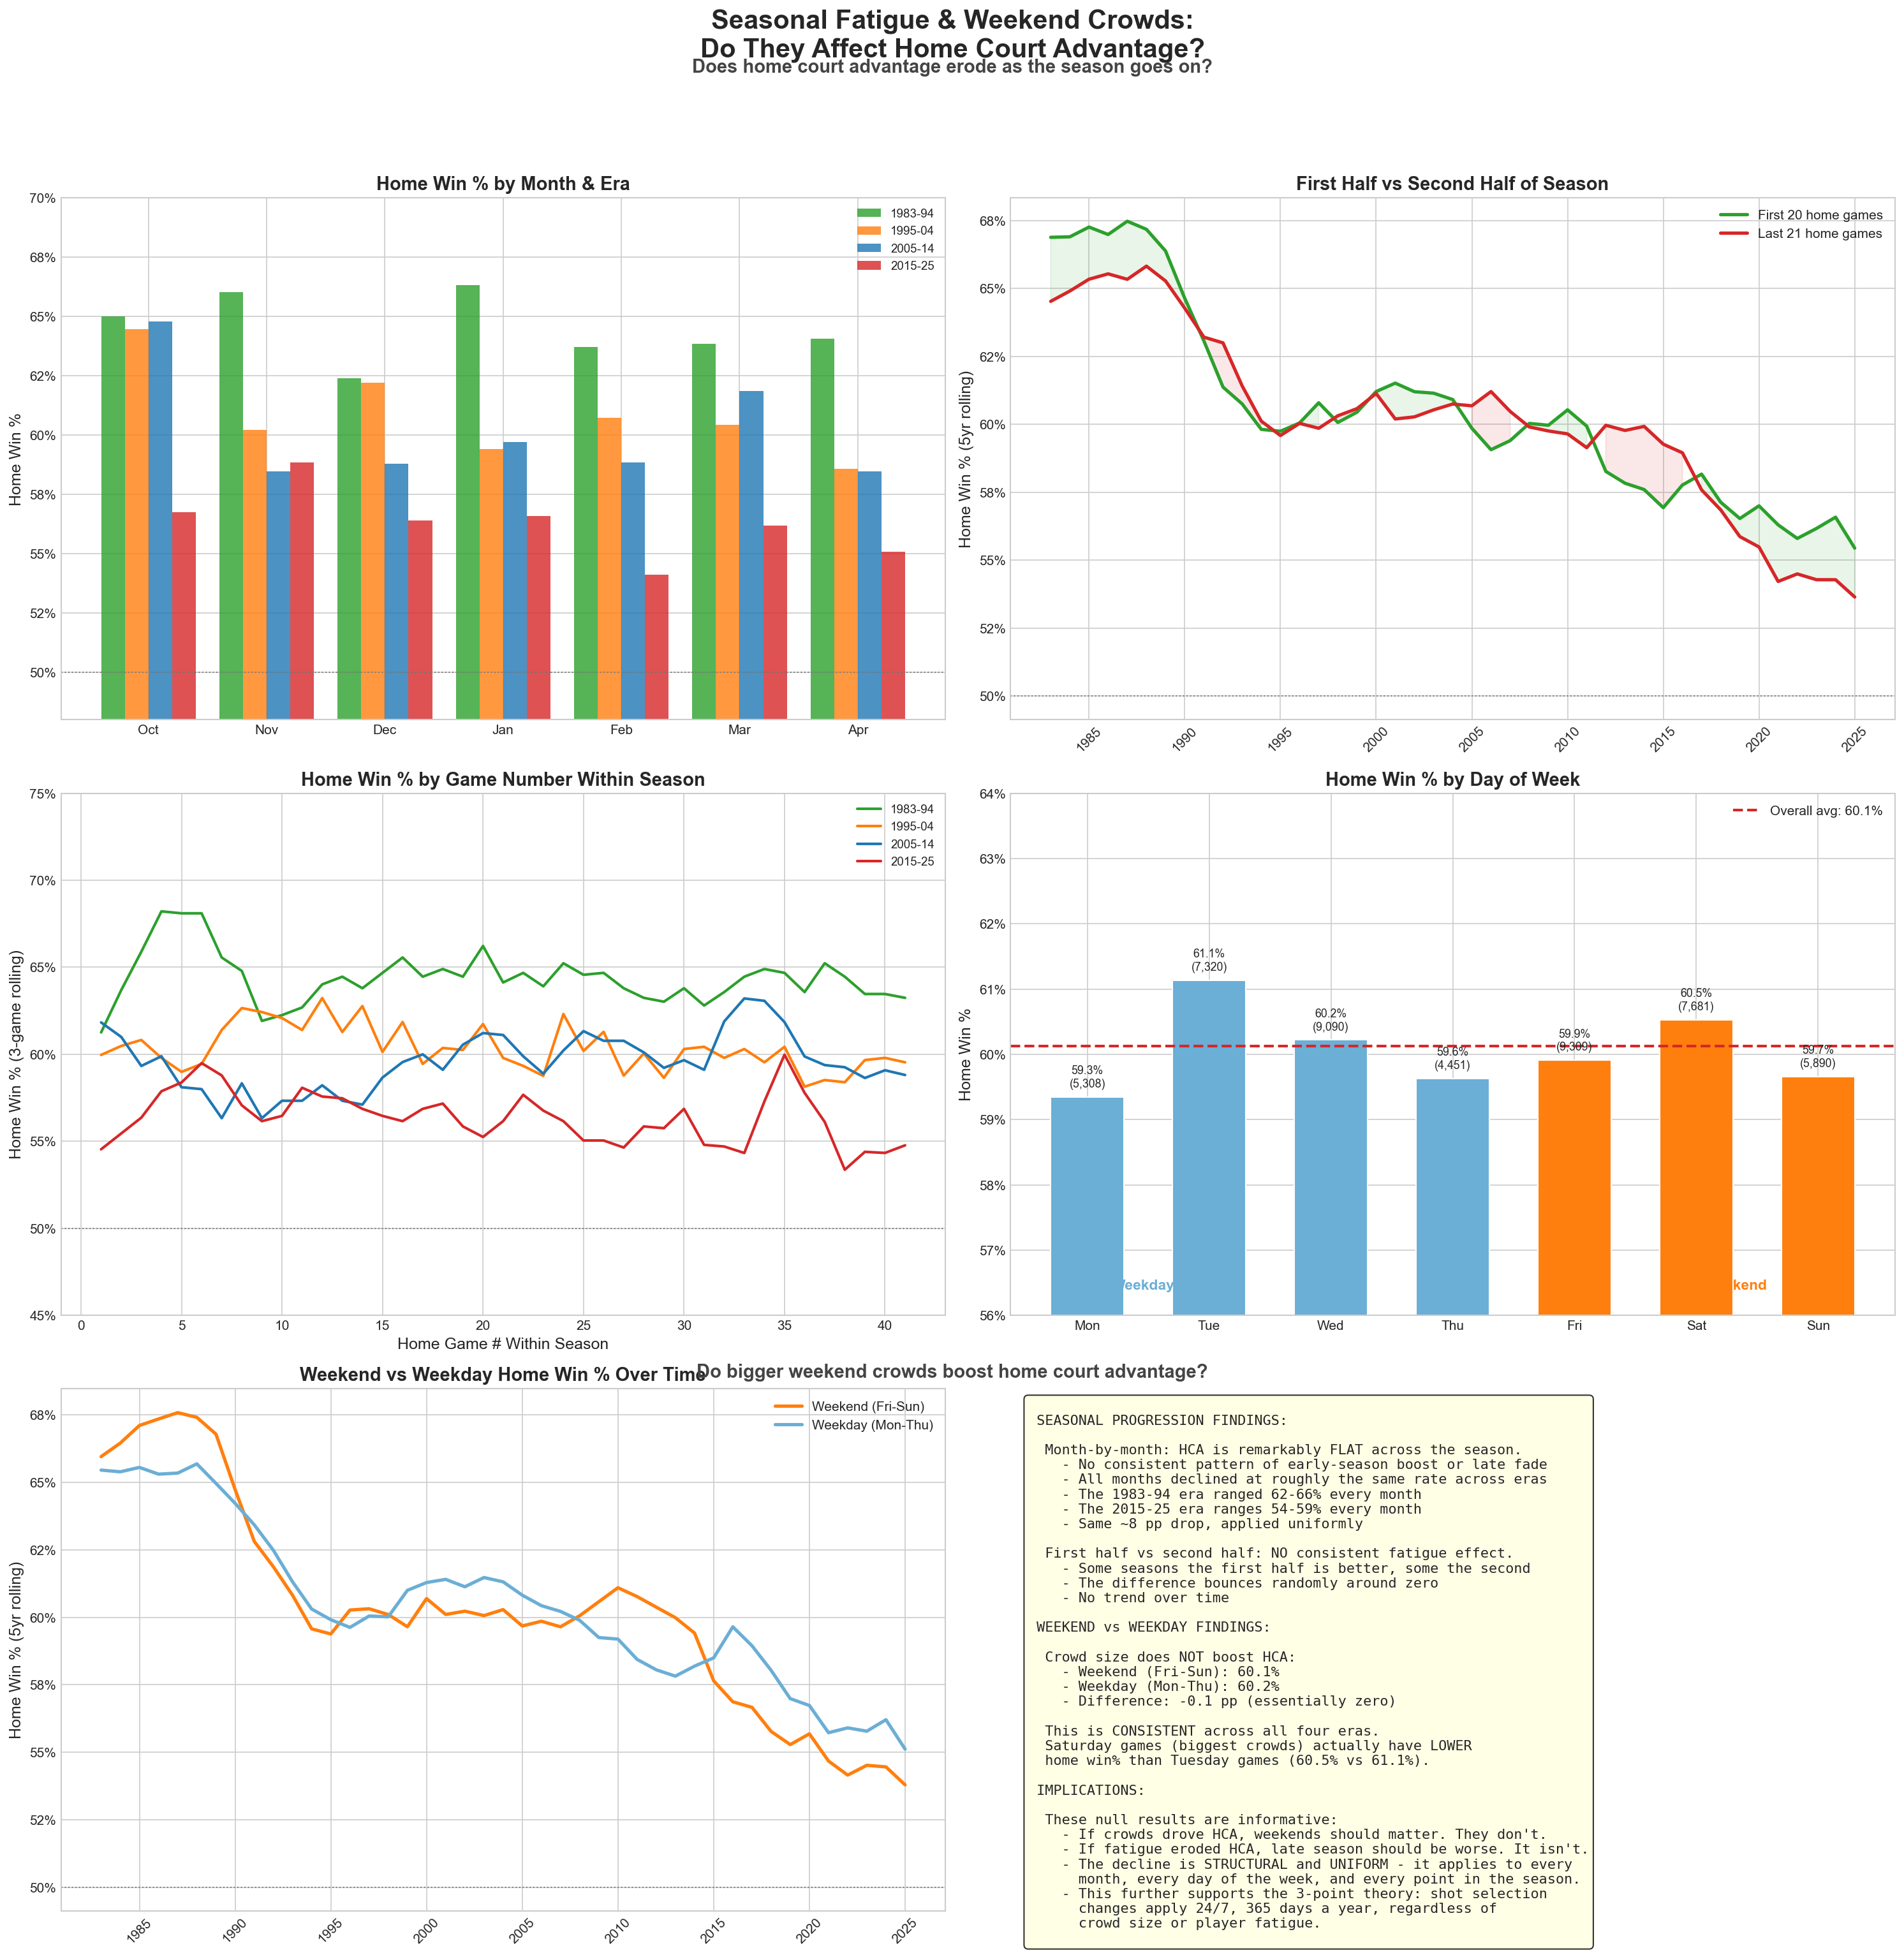
Seasonal Progression: No Fatigue Effect
Home court advantage is remarkably flat across the entire season. There is no consistent pattern of early-season boost or late-season fade:
| Month | 1983–94 | 1995–04 | 2005–14 | 2015–25 |
|---|---|---|---|---|
| Oct | 65.0% | 64.4% | 64.8% | 56.7% |
| Nov | 66.0% | 60.2% | 58.5% | 58.8% |
| Dec | 62.4% | 62.2% | 58.8% | 56.4% |
| Jan | 66.3% | 59.4% | 59.7% | 56.6% |
| Feb | 63.7% | 60.7% | 58.8% | 54.1% |
| Mar | 63.8% | 60.4% | 61.9% | 56.2% |
| Apr | 64.0% | 58.6% | 58.5% | 55.1% |
Every month declined at roughly the same rate. The 1983–94 era ranged 62–66% regardless of month. The 2015–25 era ranges 54–59%. That’s the same ~8 pp drop applied uniformly across the calendar. Similarly, first-half vs second-half season splits bounce randomly — no consistent fatigue signal.
Weekend vs Weekday: Crowds Don’t Matter
This finding is genuinely surprising:
| Day Type | Home Win % | Games |
|---|---|---|
| Weekend (Fri–Sun) | 60.1% | 22,880 |
| Weekday (Mon–Thu) | 60.2% | 26,169 |
| Difference | -0.1 pp |
The gap is effectively zero. Saturday games (traditionally the biggest, loudest crowds) actually have lower HCA than Tuesday games (60.5% vs 61.1%). This pattern holds across all four eras. In the most recent era (2015–25), weekday games even have meaningfully higher HCA than weekends (57.1% vs 55.5%).
Verdict: Both seasonal fatigue and crowd size are ruled out. HCA doesn’t erode through the season, and bigger weekend crowds don’t produce more home advantage. The decline is structural and uniform — it applies to every month, every day of the week, and every point in the season. This is exactly what you’d expect if the cause is shot selection: the 3-point revolution operates 24/7, regardless of crowd size or player fatigue.
5. Conclusion: Connecting the Pieces
After analyzing 52,000+ NBA games, 4,600+ EuroLeague games, and systematically testing ten separate hypotheses, a clear picture emerges.
What Matters
The 3-point revolution is the primary cause. It has the strongest correlation (r = -0.88), passed a natural experiment (the short 3-point line), and is confirmed by the international comparison (EuroLeague control group). The mechanism works through two compounding channels. First, the 2-point shooting edge collapsed: home teams used to gain +2.4 points per game from shooting better inside the arc, now it’s just +1.0 — partly because the gap itself shrank, and partly because there are simply far fewer 2-point attempts for the gap to apply to. Second, the free throw advantage halved: fewer drives mean fewer fouls, which means less opportunity for crowds to influence referees. Together, these two channels lost ~2.4 points of home edge, while the growing 3-point shooting edge only recovered ~0.5 points.
Load management (~15–20%). Fewer road back-to-backs and teams resting stars on home B2Bs account for a meaningful but secondary portion of the decline.
What Doesn’t Matter
Travel distance: Almost zero correlation (r = -0.01). The decline is uniform across all distance bands. Ruled out.
Time zones: Real per-game effect (5 pp for eastward travel) but not changing over time. All time-zone categories declined equally. Does not explain the trend.
COVID: Revealed the crowd effect (~2 pp regular season, ~8 pp playoffs) but didn’t cause the decline. Home win% was already 55% before the pandemic, and hasn’t recovered despite full crowds returning.
Pace of play: Counterintuitively, faster pace increases home advantage (+4.9 pp for fast vs slow games). The pace increase of the 2010s has actually been partially masking the decline. Multiple regression confirms: after controlling for 3PA, pace has a positive coefficient.
Seasonal fatigue: HCA is remarkably flat from October through April. No month shows a stronger or weaker home edge. First half vs second half of the season: random noise around zero. The ~8 pp decline applied uniformly to every month.
Weekend crowds: Perhaps the most surprising null result. Weekend games (bigger, louder crowds) show identical home advantage to weekday games (60.1% vs 60.2%). Saturday games actually have lower HCA than Tuesdays. If crowd energy were the main driver of HCA, this would be impossible.
The Scorecard
| Hypothesis | Correlation / Effect | Verdict |
|---|---|---|
| 3-Point Revolution | r = -0.88 | Primary cause |
| FTA / Referee Channel | r = 0.85 | Key mechanism |
| Short 3PT Line Experiment | Predicted & confirmed | Causal evidence |
| EuroLeague Control Group | No 3PT boom → no decline | Strongest evidence |
| Load Management / B2Bs | ~15–20% of decline | Secondary factor |
| COVID / Crowds | ~2 pp regular season | Revealed, not caused |
| Travel Distance | r = -0.01 | Ruled out |
| Time Zones / Jet Lag | 5 pp per-game, no trend | Ruled out |
| Pace of Play | r = +0.23 (opposite direction) | Ruled out |
| Seasonal Fatigue | Flat across all months | Ruled out |
| Weekend Crowds | -0.1 pp (no effect) | Ruled out |
The Bottom Line
The 3-point shot is the great equalizer of modern basketball. It has democratized offense, created one of the most exciting eras of NBA basketball — and quietly destroyed one of the sport’s oldest advantages. When a team can generate efficient offense from 24 feet out regardless of which arena they’re in, the crowd noise, the familiar rims, and the favorable whistle matter less and less. Home court advantage isn’t dead. But in the age of the 3-pointer, it’s on life support.
Data sources: NBA game data from stats.nba.com via nba_api (1983–2026). EuroLeague game and box score data from api-live.euroleague.net (2007–2025). European domestic league data from academic research (Pollard & Gómez). All analysis code and datasets available in the project repository.
Want Custom Analytics Like This?
Sparkle Technologies turns raw data into actionable intelligence. If you have a dataset and a question, let’s talk.
Get in Touch →